2020-2021 APM Measurement Methodology Report
- April 10, 2026
- Posted by: Jaime Cruz
- Categories:
No Comments
Collaboratives and Innovative Partnerships
Washington Multi-Payer Collaborative
Initiative Description: The Washington State Health Care Authority formed a Multi-Payer Collaborative (MPC) to increase access to high-quality comprehensive primary care to improve health care outcomes. The MPC aims to improve primary care by enhancing the patient experience, improving population health outcomes, reducing costs, and improving the work life of health care providers. Part of the work being done by the MPC is the introduction of the MPC Learning Cohort, which will be an avenue for providers to shape where payers align their efforts to create primary care provider supports.
Strategic and Tactical Uses: Practices that are good candidates and meet certain characteristics can join an MPC Learning Cohort and help guide health plan alignment. Those that are not involved in the Washington MPC can use the strategies and direction of the MPC to help shape their own guiding principles. Practices in Washington that are participating in the Centers for Medicare & Medicaid Services’ new Making Care Primary model can benefit from the lessons of MPC’s current Learning Cohort to enable greater success in the new model.
Multi-payer Alignment Foundational Element: Providing and Leveraging Technical Assistance
Timeframe: Active
For additional information, please visit https://www.hca.wa.gov/about-hca/programs-and-initiatives/value-based-purchasing/primary-care-transformation
Stakeholders can reach out to the Multi-payer Collaborative directly with questions wampc-cebpstaff@ohsu.edu
Who Might Use This: ![]() Health Plans
Health Plans
Collaboratives and Innovative Partnerships
Vermont’s All-Payer Accountable Care Organization Model
Initiative Description: The Vermont All-Payer Accountable Care Organization (ACO) Model (VTAPM) began on January 1, 2017 and is scheduled to end on December 31, 2024. It is a culmination of Vermont’s commitment to health care transformation, building from Vermont’s Global Commitment to Health Section 1115 waiver, the Blueprint for Health, and a multi-payer ACO Shared Savings Program (SSP) pilot under Vermont’s State Innovation Models (SIM) Testing Grant. Medicare, Medicaid, BlueCross BlueShield of Vermont (BCBSVT), MVP Health Care, and the State Employees’ Health Care Plan — a self-insured plan administered by BCBSVT — participate in the model, representing the majority of covered lives in the state. The Model is administered by OneCare Vermont, which coordinates all funding from all VTAPM payment mechanisms — all-inclusive population-based payment, fixed prospective payment, and traditional fee-for-service (FFS). The Model aims to use this ACO structure to reduce statewide spending and improve population health outcomes.
Strategic and Tactical Uses: The VTAPM has been linked to reductions in Medicare spending, decreases in acute hospital and specialty visits, and efforts to improve care coordination and strengthen primary care. Despite these successes, the Model had mixed success related to payment reform, with FFS as the primary funding mechanism by participating commercial plans, and mixed quality measure alignment, with only 7 of the 18 OneCare measures in common among participating health plans. Other states can look to the VTAPM model to understand how decades of work toward health care payment reform efforts can be used to develop a statewide model with successful cost and quality outcomes. Lessons learned from the evaluation report — including the need to align financial incentives and attribution, and the importance of goal setting for aligned payment mechanisms (see additional information below) — should also be reviewed for states looking to leverage findings from Vermont.
Multi-payer Alignment Foundational Element: Aligning Key Payment Model Components
Timeframe: Active
For additional information, please visit
https://www.cms.gov/priorities/innovation/
data-and-reports/2023/vtapm-3rd-eval-full-report
Who Might Use This: ![]() Health Plans
Health Plans
Government Regulation and Guidance
Updated Centers for Medicare & Medicaid Services Health Equity Framework
Initiative Description: The Centers for Medicare & Medicaid Services (CMS) has updated the agency’s Framework for Health Equity, expanding upon its initial 2022-2032 priorities. The five priorities for reducing disparities in health include: expanding the collection, reporting, and analysis of standardized data; assessing causes of disparities within CMS programs, and addressing inequities in policies and operations to close gaps; building capacity of health care organizations and the workforce to reduce disparities in health and health care; advancing language access, health literacy, and the provision of culturally tailored services; and increasing all forms of accessibility to health care services and coverage.
Strategic and Tactical Uses: The Framework offers insight on alignment priorities for health equity data collection, sharing, and use to reduce observed health disparities.
Multi-payer Alignment Foundational Element: Whole Person Care
Timeframe: Active
For additional information, please visit https://www.cms.gov/About-CMS/Agency-Information/OMH/health-equity-programs/cms-framework-for-health-equity
Who Might Use This: ![]() Health Plans |
Health Plans | ![]() Purchasers |
Purchasers | ![]() Providers |
Providers | ![]() Policy Makers |
Policy Makers | ![]() Enabling Organizations |
Enabling Organizations | ![]() Community-Based Organizations
Community-Based Organizations
Government Regulation and Guidance
Trusted Exchange Framework Common Agreement Standards
Initiative Description: The Trusted Exchange Framework Common Agreement (TEFCA) was published by the Office of the National Coordinator for Health Information Technology (ONC) to establish the infrastructure model and governing approach for users in different networks to securely share basic clinical information with each other, all under commonly agreed-to expectations and rules. TEFCA describes a common set of non-binding, foundational principles for trust policies and practices that can help facilitate an exchange among organizations. These principles include standardization, transparency, cooperation and non-discrimination, privacy, security, patient safety, access, and data-driven accountability.
Strategic and Tactical Uses: Currently, providers may have disparate access to patient data across multiple networks, adding to their administrative burden. Patients may also struggle to access their own data easily. As TEFCA becomes operational, organizations and patients will benefit from improved access to data as TEFCA aims to create seamless nationwide exchange.
Multi-payer Alignment Foundational Element: Timely and Consistent Data Sharing
Timeframe: Active
For additional information, please visit
https://www.healthit.gov/topic/
interoperability/policy/trusted-
exchange-framework-and-common-
agreement-tefca
Who Might Use This: ![]() Health Plans |
Health Plans | ![]() Providers |
Providers | ![]() Policy Makers
Policy Makers
Government Regulation and Guidance
The Universal Foundation Measure Set
Initiative Description: In an effort to align measures that drive quality improvement and care transformation, the Centers for Medicare & Medicaid Services (CMS) selected adult and pediatric measures that promote the best, safest, and most equitable care for individuals across critical quality areas: wellness and prevention, chronic conditions, behavioral health, person-centered care, and seamless care coordination. The measures will be used across CMS quality programs and prioritized for stratification and digitization.
Strategic and Tactical Uses: Organizations can compare the Universal Foundation with other aligned measure sets to identify overlap and prioritize measures for multi-payer implementation initiatives. The Universal Foundation will continue to evolve over time with population-specific “add-on” measure sets.
Multi-payer Alignment Foundational Element: Performance Measurement and Reporting
Timeframe: Active
For additional information, please visit https://www.cms.gov/aligning-quality-measures-across-cms-universal-foundation
Who Might Use This: ![]() Health Plans |
Health Plans | ![]() Providers |
Providers | ![]() Purchasers |
Purchasers | ![]() Policy Makers
Policy Makers
Alignment Resources and Helpful Documents
The Future of Sustainable Value-Based Payment:
Voluntary Best Practices to Advance Data Sharing
Initiative Description: The National Association of Accountable Care Organizations (NAACOs), American Medical Association (AMA), and AHIP created a playbook that presents voluntary guidelines and best practices to advance data sharing, which includes data privacy, data infrastructure, value-based care participant readiness, federal health information technology requirements, and financial investment. The playbook is based on findings from an advisory workgroup comprising members from each partner association, a managing committee of association leaders, a literature review, an environmental scan, and interviews with subject matter experts.
Strategic and Tactical Uses: Organizations can use the playbook to develop or refine their own value-based care strategy, especially with regard to data and infrastructure practices.
Multi-payer Alignment Foundational Element: Timely and Consistent Data Sharing
Timeframe: Active
For additional information, please visit https://static1.squarespace.com/static/66902b12f1fed363b0b53399/t/
672bc13f3280b257e6ba342d/1730920768222/Voluntary-Best-Practices-to-Advance-Data-Sharing.pdf
Who Might Use This:![]() Health Plans |
Health Plans | ![]() Purchasers |
Purchasers | ![]() Providers |
Providers | ![]() Policy Makers |
Policy Makers | ![]() Enabling Organizations |
Enabling Organizations | ![]() Community-Based Organizations
Community-Based Organizations
Collaboratives and Innovative Partnerships
North Carolina Healthy Opportunities Pilots
Initiative Description: The North Carolina Health Opportunities Pilots (HOP), part of NC’s Section 1115 waiver, is a comprehensive program dedicated to solving non-medical needs for Medicaid enrollees. HOP covers the cost of 29 interventions defined and priced in the Department of Health and Human Services’ Pilot Fee Schedule, including housing navigation and move-in fees, food and nutrition access care, transportation reimbursement, and violence intervention services. The North Carolina Department of Health and Human Services intends to expand HOP services to new populations beginning with those eligible for Tailored Care Management.
Strategic and Tactical Uses: HOP is the country’s first comprehensive program to reimburse for such a broad set of services and, unlike traditional Medicaid services, supports the enrollee and their family (e.g., an enrollee who is food insecure will receive a food box covering the entire family). Other states can use North Carolina’s HOP program to evaluate the benefits of non-medical interventions. Based on the reports from the Department of Health and Human Services, similar programs can be implemented across other states, helping to reduce health care costs and improve population health.
Multi-payer Alignment Foundational Element: Whole Person Care
Timeframe: Active
For additional information, please visit https://www.ncdhhs.gov/about/department-initiatives/healthy-opportunities/healthy-opportunities-pilots and https://ncmedicaljournal.com/article/94844-reflecting-on-nearly-two-years-of-north-carolina-s-healthy-opportunities-pilots
Who Might Use This: ![]() Health Plans |
Health Plans | ![]() Providers |
Providers | ![]() Community-based Organizations
Community-based Organizations
Collaboratives and Innovative Partnerships
NCCARE360
Initiative Description: NCCARE360 is a statewide network that unites health care and human services organizations with a shared technology. The NCCARE360 implementation team includes United Way of North Carolina/NC 211, Unite Us, and Expound Decision Systems. These organizations link people and families to free and local health and human services resources, offer a platform for secure and timely care coordination and outcomes, and create a data repository model to manage social determinants of health resources in North Carolina.
Strategic and Tactical Uses: North Carolina community-based organizations, health plans, and health systems can join the NCCARE360 network and gain access to the resources that they provide. Outside of North Carolina, organizations can look to form a public-private partnership like NCCARE360 and create a similar cross-sectoral referral technology platform or expand their current platforms to a statewide scale.
Multi-payer Alignment Foundational Element: Timely and Consistent Data Sharing, Whole Person Care
Timeframe: Active
For additional information, please visit https://nccare360.org/
Who Might Use This: ![]() Health Plans |
Health Plans | ![]() Providers |
Providers | ![]() Enabling Organizations |
Enabling Organizations | ![]() Community-Based Organizations
Community-Based Organizations
Collaboratives and Innovative Partnerships
National Quality Forum Aligned Innovation
Initiative Description: Aligned Innovation is a multi-stakeholder initiative from the National Quality Forum (NQF) that advances quality measures for behavioral health and maternal health outcomes. The recent new measures prioritized by the Coalition include outcomes for mild to moderate behavioral health conditions and the reduction of severe maternal morbidity. The program is differentiated by a rapid-cycle measure development process, rather than the multi-year timeframe that’s typical of traditional measure development.
Strategic and Tactical Uses: These measures are outcome-oriented and patient-centered and can be used to support prospective measure alignment across the industry. Health plans not participating in Aligned Innovation can look to the initiative for lessons on measure development and achieving shared implementation.
Multi-payer Alignment Foundational Element: Performance Measurement and Reporting
Timeframe: Active
For additional information, please visit https://www.qualityforum.org/en-us/news/nqf_s_aligned_innovation_
initiative_to_advance_next_generation_measures_of_outcomes_for_behavioral, https://www.qualityforum.org/en-us/key-initiatives/aligned-innovation
Who Might Use This: ![]() Health Plans
Health Plans
Collaboratives and Innovative Partnerships
National Committee for Quality Assurance Bulk FHIR Coalition
Initiative Description: The Bulk FHIR Quality Coalition is a National Committee for Quality Assurance (NCQA) and public-private sector collaboration focused on leveraging regulated Fast Healthcare Interoperability Resources (FHIR) data for NCQA’s Healthcare Effectiveness Data and Information Set (HEDIS) measures. Phase 1 of the Coalition involves health plans, providers, and accountable care organization cohorts that create pipelines from clinical data and claims data, which are tested and validated against specific HEDIS FHIR Implementation Guides from NCQA.
Strategic and Tactical Uses: By participating in NCQA’s Bulk FHIR Coalition, organizations can be at the forefront of health care technology and data management, as well as support the broader goals of enhancing health care quality, efficiency, and patient outcomes. Organizations not yet ready to participate can follow the results of the Coalition for future implementation.
Multi-payer Alignment Foundational Element: Timely and Consistent Data Sharing
Timeframe: Active
For additional information, please visit https://www.ncqa.org/bulk-fhir-api-quality-coalition/
Who Might Use This: ![]() Health Plans |
Health Plans | ![]() Providers |
Providers | ![]() Policy Makers
Policy Makers
Collaboratives and Innovative Partnerships
Minnesota Community Measurement
Initiative Description: Minnesota Community Measurement (MCM) is using data to improve health care in the region. They work with doctors, hospitals, clinics, insurance companies, purchasers, and state agencies to design measures, and then collect, analyze, and share actionable data on health care quality and cost. MCM releases a variety of annual public reports, including cost and utilization, health care quality, disparities by plan and demographics, and spotlight reports. These reports help consumers compare and choose clinics based on quality and cost ratings, understand the care they should receive, and learn how to save money on their care.
Strategic and Tactical Uses: MCM hosts public meetings and forums in order to gather community feedback on upcoming measures, guiding principles, specifications, and priorities. Entities in Minnesota are also encouraged to become members of MCM and help further their mission of using data to improve the health care industry.
Multi-payer Alignment Foundational Element: Performance Measurement and Reporting, Timely and Consistent Data Sharing
Timeframe: Active
For additional information, please visit https://mncm.org/
Who Might Use This: ![]() Health Plans |
Health Plans | ![]() Providers |
Providers | ![]() Purchasers
Purchasers
Collaboratives and Innovative Partnerships
Massachusetts Quality Measure Alignment Taskforce
Initiative Description: Massachusetts began convening the Taskforce in 2017 in order to: (1) build consensus on an aligned measure set for voluntary adoption by health plans in global budget-based risk contracts, (2) identify strategic priority areas for measure development, and (3) advise on the measurement and reporting of health inequities. Since 2017, the Taskforce has released annually updated measure sets for shared implementation. The Taskforce also maintains “Developmental Set measure topics,” which lists topics and measures that may be implemented in the future.
Strategic and Tactical Uses: The state releases a yearly Massachusetts Aligned Measure Set for health plan uptake and alignment. The Taskforce publicly tracks uptake of the measure set and reports findings. Adherence to the Aligned Measure Set among insurers that report to the Task Force has steadily increased from 65% in 2019 to 93% in 2023. Other states can look to the Taskforce to pursue and track measure alignment or expand the work to create a cross-state approach to quality measure alignment.
Multi-payer Alignment Foundational Element: Performance Measurement and Reporting
Timeframe: Active
For additional information, please visit https://www.mass.gov/info-details/eohhs-quality-measure-alignment-taskforce
Who Might Use This: ![]() Health Plans
Health Plans
Collaboratives and Innovative Partnerships
Kentuckiana Health Collaborative
Initiative Description: The Kentuckiana Health Collaborative (KHC) is a coalition of businesses and health care stakeholders focused on improving health care quality, making health care more affordable, and promoting equitable health care. KHC leads efforts for consolidated measurement and reporting by working with health plans to collect claims data that informs a quality measure list and reporting.
Strategic and Tactical Uses: KHC releases the Kentucky Core Healthcare Measures Set (KCHMS) bi-yearly. The measure set includes 42 primary care quality measures that serve as the foundation for KHC’s consolidated reporting. The set aims to reduce provider reporting complexity and align Kentucky’s health care organizations around a common set of quality measures. Other states can look to KHC for how to publicly report on quality measures.
Multi-payer Alignment Foundational Element: Performance Measurement and Reporting
Timeframe: Active
For additional information, please visit https://khcollaborative.org
Who Might Use This: ![]() Health Plans |
Health Plans | ![]() Purchasers
Purchasers
Alignment Resources and Helpful Documents
Integrated Healthcare Association’s Align. Measure. Perform. Program
Initiative Description: The Integrated Healthcare Association’s (IHA) Align. Measure. Perform. (AMP) program is an initiative designed to improve health care quality and reduce costs through a coordinated approach in California. The program seeks to align incentives, measure performance, and reward high-quality, cost-effective care. AMP has four program components: an aligned measure set and benchmarking, incentive design, public reporting, and public recognition. Today, 16 health plans and more than 200 physician organizations participate in AMP.
Strategic and Tactical Uses: Plans, providers, and patients in California can participate in AMP programs by implementing measures, identifying improvement opportunities, and reviewing publicly reported results to make decisions about their health care providers. Other states or convening organizations can look to the AMP program for guidance on collective action toward value-based payment and quality measure improvement.
Multi-payer Alignment Foundational Element: Aligning Key Payment Model Components, Timely and Consistent Data Sharing, Performance Measurement and Reporting
Timeframe: Active
For additional information, please visit https://iha.org/performance-measurement/amp-program/
Who Might Use This: ![]() Health Plans |
Health Plans | ![]() Providers
Providers
Government Regulation and Guidance
Final Rule to Expand Access to Health Information and Improve the Prior Authorization Process
Initiative Description: The final rule requires Medicare Advantage (MA) organizations, Medicaid and the Children’s Health Insurance Program (CHIP) fee-for-service (FFS) programs, Medicaid managed care plans, CHIP managed care entities, and issuers of Qualified Health Plans (QHPs) offered on the Federally-Facilitated Exchanges (FFEs) to improve the electronic exchange of health information and prior authorization processes for medical items and services. It also requires the same entities to implement a Health Level 7 (HL7) Fast Healthcare Interoperability Resources (FHIR) prior authorization application programming interface (API), which can be used to facilitate a more efficient electronic prior authorization process between providers and health plans by automating the end-to-end prior authorization process. Compliance requirements will begin in January 2027.
Strategic and Tactical Uses: Medicare FFS has already implemented an electronic prior authorization API, demonstrating the efficiencies other health plans could realize by implementing such an API. By implementing the requirements, the prior authorization process will reduce administrative burden on the healthcare workforce, empower clinicians to spend more time with patients, and prevent avoidable delays in care for patients. Health plans can prepare for compliance ahead of the start date January 1, 2027.
Multi-payer Alignment Foundational Element: Timely and Consistent Data Sharing
Timeframe: Upcoming
For additional information, please visit https://www.cms.gov/newsroom/press-releases/cms-finalizes-rule-expand-access-health-information-and-improve-prior-authorization-process
Who Might Use This: ![]() Health Plans |
Health Plans | ![]() Providers |
Providers | ![]() Enabling Organizations
Enabling Organizations
Collaboratives and Innovative Partnerships
Delaware Primary Care Reform Collaborative
Initiative Description: The Delaware Health Care Commission created the Delaware Primary Care Reform Collaborative as part of a statewide effort to expand value-based care delivery models. The Collaborative develops recommendations to strengthen the primary care system in Delaware and includes health plans, providers, and Delaware state health leaders. The Collaborative also creates annual reports that provide insight into the primary care workforce and other relevant trends.
Strategic and Tactical Uses: The Delaware Primary Care Reform Collaborative hosts open meetings and posts the schedule, along with meeting minutes and materials, to their website for the public to review. The Collaborative also publishes trends and guidelines that result from their meetings. Other state agencies and collaboratives can learn from and collaborate with the Delaware Primary Care Reform Collaborative to draw larger, nationwide alignment on value-based care solutions.
Multi-payer Alignment Foundational Element: Aligning Key Payment Model Components, Performance Measurement and Reporting
Timeframe: Active
For additional information, please visit https://dhss.delaware.gov/dhss/dhcc/
collab.html
Who Might Use This: ![]() Health Plans |
Health Plans | ![]() Purchasers |
Purchasers | ![]() Providers |
Providers | ![]() Policy Makers |
Policy Makers | ![]() Enabling Organizations |
Enabling Organizations | ![]() Community-Based Organizations
Community-Based Organizations
Government Regulation and Guidance
Cures Act Final Rule for Data Sharing
Initiative Description: The Office of the National Coordinator for Health Information Technology’s (ONC) Cures Act Final Rule aims to promote secure access, exchange, and use of electronic health information. The Act accelerates the uptake of standardized application programming interfaces (APIs), requires IT developers to provide API capabilities for population health management, and increases patient access to electronic health information.
Strategic and Tactical Uses: This rule helps to standardize the measure reporting process by promoting interoperability and enabling access to patient-level data from health plans, providers, and patients. Organizations should continue to track ongoing updates to the data sharing infrastructure.
Multi-payer Alignment Foundational Element: Timely and Consistent Data Sharing
Timeframe: Active
For additional information, please visit https://www.healthit.gov/buzz-blog/category/21st-century-cures-act
Who Might Use This: ![]() Health Plans |
Health Plans | ![]() Purchasers |
Purchasers | ![]() Providers |
Providers | ![]() Policy Makers |
Policy Makers | ![]() Enabling Organizations |
Enabling Organizations | ![]() Community-Based Organizations
Community-Based Organizations
Collaboratives and Innovative Partnerships
Covered California’s Quality Transformation Initiative
Initiative Description: Covered California’s Quality Transformation Initiative (QTI) is focused on improving care for a small number of clinically important conditions for which there are major opportunities for improvement and established measures in current use. The four clinical areas of focus for improvement that are subject to Quality Transformation Fund payments are Controlling High Blood Pressure, Comprehensive Diabetes Care: Hemoglobin A1c Control, Colorectal Cancer Screening, and Childhood Immunization Status. Qualified Health Plan (QHP) issuers that fail to meet specified measure benchmarks will be required to make payments to the Quality Transformation Fund. For Measurement Year 2023, QHP final scores will be confirmed in September 2024, and issuer performance will be finalized and published by Spring 2025.
Strategic and Tactical Uses: QHP issuers in California can join the QTI to benefit from the financial incentives and quality measure improvements. For QHP issuers outside of California or other state agencies, this initiative can be used to set a baseline for financial incentives and quality measure alignment.
Multi-payer Alignment Foundational Element: Aligning Key Payment Model Components, Performance Measurement and Reporting
Timeframe: Active
For additional information, please visit https://hbex.coveredca.com/stakeholders/
plan-management/qti/
Who Might Use This: ![]() Health Plans |
Health Plans | ![]() Providers
Providers
Collaboratives and Innovative Partnerships
Core Quality Measures Collaborative Measure Sets
Initiative Description: The Core Quality Measures Collaborative (CQMC) develops and releases core sets of quality measures for 10 clinical focus areas (primary care, behavioral health, cardiology, gastroenterology, Human Immunodeficiency Virus/Hepatitis C, medical oncology, neurology, obstetrics and gynecology, orthopedics, and pediatrics). CQMC Workgroups convene on an annual basis to update the existing core sets, conduct yearly maintenance, and hear from a broad-based coalition of health care leaders to gain different perspectives on the measures and consider new ones.
Strategic and Tactical Uses: Organizations can compare the CQMC measure sets with other aligned sets to identify overlap and prioritize measures for multi-payer implementation initiatives. Organizations should also look to CQMC’s non-primary care measure sets with partners to increase industry alignment in specialty care.
Multi-payer Alignment Foundational Element: Performance Measurement and Reporting
Timeframe: Active
For additional information, please visit https://digitalassets.jointcommission.org/api/public/content/4ac498d3dabf46feb730c3811bb8d382?v=4500a962
Who Might Use This: ![]() Health Plans |
Health Plans | ![]() Providers |
Providers | ![]() Purchasers
Purchasers
Collaboratives and Innovative Partnerships
Colorado Social Health Information Exchange (SHIE)
Initiative Description: The Colorado State Health Information Exchange (SHIE) will be a network of social health data, insights, and resources that helps people understand and access the best path to positive health outcomes. The state is actively building a unifying architecture that provides a secure overarching network for the sharing of health information between providers. Regional hubs are also part of the SHIE program and will ensure that SHIE development is driven by the needs and priorities of people in Colorado.
Strategic and Tactical Uses: Colorado providers will be able to use SHIE to meet their patients’ holistic needs more effectively, reduce administrative burden, and improve care utilization. The Office of eHealth Innovation (OeHI) is developing their regional health approach and will be soliciting applications from community care organizations seeking to share data through the architecture. Organizations across the health care industry can stay informed on OeHI’s progress by attending webinars and reviewing the Office’s helpful resources.
Multi-payer Alignment Foundational Element: Timely and Consistent Data Sharing, Whole Person Care
Timeframe: Upcoming
For additional information, please visit https://oehi.colorado.gov/SHIE
Who Might Use This: ![]() Health Plans |
Health Plans | ![]() Providers |
Providers | ![]() Policy Makers |
Policy Makers | ![]() Enabling Organizations
Enabling Organizations
Government Regulation and Guidance
Colorado Regulation 4-2-96 Concerning Primary Care Alternative Payment Model Parameters
Initiative Description: Colorado’s recent Regulation 4-2-96 directs the Division of Insurance (DOI) to establish aligned parameters for primary care alternative payment models (APMs). Regulation 4-2-96 aims to improve health care quality and outcomes in a manner that reduces health disparities, actively advances health equity, and increases the number of Coloradans who receive the right care at the right time and place at an affordable cost. The DOI engaged a broad array of organizations in order to gather feedback and insight prior to developing and promulgating a rule on quality measures, patient attribution, risk adjustment, and core competencies.
Strategic and Tactical Uses: Health insurance carriers must annually report on their use of the aligned APM parameters for primary care services. For plans issued or renewed on or after January 1, 2025, the APM Implementation Plan must conform to the alignment parameters in the new regulation. DOI will continue to engage organizations as the alignment parameters are reviewed and updated on an annual basis. Other state agencies can monitor Colorado’s experience with using regulation to drive alignment and consider adopting a similar strategy.
Multi-payer Alignment Foundational Element: Aligning Key Payment Model Components, Performance Measurement and Reporting
Timeframe: Upcoming
For additional information, please visit https://doi.colorado.gov/hb22-1325-primary-care-alternative-payment-models/
Who Might Use This: ![]() Health Plans
Health Plans
Collaboratives and Innovative Partnerships
Colorado Primary Care Payment Reform Collaborative
Initiative Description: Created through HB 19-1233 and convened by the Division of Insurance (DOI), the Colorado Primary Care Payment Reform Collaborative (PCPRC) has been meeting since July of 2019. The PCPRC focuses on developing strategies for increased investments in primary care and advises on the development of affordability standards and targets for carrier investments in primary care. The PCPRC is also working on strategies to reduce health care costs, implement evidence- and value-based incentives, direct resources to the patients and practices that need increased capacity, and sustain advanced primary care delivery models.
Strategic and Tactical Uses: The Collaborative has open meetings for members of the health care community to join and advocate for primary care strategies. Active members of the Colorado health care community are encouraged to join the Collective and influence the future of primary care payment reform in Colorado. Health plans, providers, and other organizations from other states can build a group like Colorado’s to align on primary care payment goals in their state.
Multi-payer Alignment Foundational Element: Aligning Key Payment Model Components, Performance Measurement and Reporting, Whole Person Care, Providing and Leveraging Technical Assistance
Timeframe: Active
For additional information, please visit https://doi.colorado.gov/insurance-products/health-insurance/health-insurance-initiatives/primary-care-payment-reform
Who Might Use This: ![]() Health Plans |
Health Plans | ![]() Purchasers |
Purchasers | ![]() Providers |
Providers | ![]() Policy Makers |
Policy Makers | ![]() Enabling Organizations |
Enabling Organizations | ![]() Community-Based Organizations
Community-Based Organizations
Government Regulation and Guidance
Civitas Networks for Health
Initiative Description: Civitas Networks for Health (Civitas) brings together organizations that focus on improving health in communities throughout the country through data-led multi-stakeholder collaboration. Civitas focuses on increasing collaboration and shared learning, providing thought leadership and technical expertise, and educating public and private entities about the benefits, functions, and roles of Civitas’ community. Members and topics include all-payer claims databases, health information exchanges, regional health improvement collaboratives, quality improvement organizations, and the emerging Health Data Utility model.
Strategic and Tactical Uses: Organizations can become members of Civitas to participate in multi-site workgroups and projects alongside organizations in pursuit of advancing interoperability and data-sharing alignment. Organizations can also learn about relevant reports, resources, and policy briefings.
Multi-payer Alignment Foundational Element: Timely and Consistent Data Sharing
Timeframe: Active
For additional information, please visit https://www.civitasforhealth.org/
Who Might Use This: ![]() Health Plans |
Health Plans | ![]() Purchasers |
Purchasers | ![]() Enabling Organizations |
Enabling Organizations | ![]() Policy Makers
Policy Makers
Government Regulation and Guidance
Centers for Medicare & Medicaid Services Medicaid Child Core Sets
Initiative Description: The Children’s Health Insurance Program Reauthorization Act of 2009 (CHIPRA) included provisions to strengthen the quality of care provided to and health outcomes of children in Medicaid and the Children’s Health Insurance Program (CHIP). It required the Department of Health and Human Services (HHS) to identify and publish a core measure set of children’s health care quality measures for voluntary use by state Medicaid and CHIP programs and to review and update the list annually. Beginning in 2024, all states are required to report on the Child Core Set, which will continue to be updated annually.
Strategic and Tactical Uses: Organizations can compare the Medicaid Child Core Set with other aligned measure sets in use, to identify overlap and prioritize measures for multi-stakeholder implementation initiatives.
Multi-payer Alignment Foundational Element: Performance Measurement and Reporting
Timeframe: Active
For additional information, please visit https://www.medicaid.gov/medicaid/quality-of-care/performance-measurement/adult-and-child-health-care-quality-measures/childrens-health-care-quality-measures/index.html
Who Might Use This: ![]() Health Plans |
Health Plans | ![]() Providers |
Providers | ![]() Enabling Organizations |
Enabling Organizations | ![]() Policy Makers
Policy Makers
Government Regulation and Guidance
Centers for Medicare & Medicaid Services Meaningful Measures Initiative
Initiative Description: The Meaningful Measures Initiative addresses measurement gaps, reduces burden, and increases efficiency by: (1) Using only high-value quality measures impacting key quality domains; (2) Aligning measures across value-based programs and across partners, including the Centers for Medicare & Medicaid (CMS), federal, and private entities; (3) Prioritizing outcome and patient-reported measures; (4) Transforming measures to be fully digital and incorporating all-payer data; (5) Developing and implementing measures reflecting social drivers/determinants of health (SDOH).
Strategic and Tactical Uses: Organizations can look toward the Meaningful Measures Initiative when developing their measure strategy. Industry movement toward similar goals (e.g., digital quality measurement) helps reduce fragmentation.
Multi-payer Alignment Foundational Element: Performance Measurement and Reporting
Timeframe: Active
For additional information, please visit https://www.cms.gov/medicare/quality/
meaningful-measures-initiative
Who Might Use This: ![]() Health Plans
Health Plans
Government Regulation and Guidance
Centers for Medicare & Medicaid Services Medicaid Adult Core Sets
Initiative Description: The Social Security Act (Section 1139B) requires the Department of Health and Human Services (HHS) to identify and publish a core set of health care quality measures for adult Medicaid enrollees and to review and update the list annually. The Adult Core Set includes a range of quality measures encompassing both physical and behavioral health. Beginning in 2024, all states are required to report on the behavioral health measures of the Adult Core Set, which will continue to be updated annually.
Strategic and Tactical Uses: Organizations can compare the Medicaid Adult Core Sets with other aligned measure sets in use, to identify commonalities and prioritize measures for multi-stakeholder implementation initiatives.
Multi-payer Alignment Foundational Element: Performance Measurement and Reporting
Timeframe: Active
For additional information, please visit https://www.medicaid.gov/medicaid/quality-of-care/performance-measurement/adult-and-child-health-care-quality-measures/adult-health-care-quality-measures/index.html
Who Might Use This: ![]() Health Plans |
Health Plans | ![]() Providers |
Providers | ![]() Policy Makers |
Policy Makers | ![]() Enabling Organizations
Enabling Organizations
Collaboratives and Innovative Partnerships
California Advanced Primary Care Initiative
Initiative Description: The California Quality Collaborative (led by the Purchaser Business Group on Health) and the Integrated Healthcare Association convene purchasers, health plans, and providers in California to strengthen the primary care delivery system. As part of this effort, health plans signed a Memorandum of Understanding (MOU) that commits them to shared primary care measures and a roadmap to advancing primary care in California. The Initiative culminates with the Payment Model Demonstration Project (July 2024-December 2025) to test a common value-based payment model with approximately 30 independent practices.
Strategic and Tactical Uses: The Initiative represents a multifaceted pilot that requires coordinated measure implementation, data sharing, and trust. In order to further statewide alignment, additional organizations in California are encouraged to sign the MOU and join the Initiative. Non-California health plans can use the MOU as a blueprint to build similar collaboratives in their state. The Advanced Primary Care Measure Set and Roadmap to Advanced Primary Care are also available for organizations looking to better align their primary care services.
Multi-payer Alignment Foundational Element: Aligning Key Payment Model Components, Performance Measurement and Reporting, Technical Assistance, Timely and Consistent Data Sharing
Timeframe: Active
For additional information, please visit https://www.pbgh.org/initiative/ca-advanced-primary-care-initiative/
Who Might Use This: ![]() Health Plans |
Health Plans | ![]() Purchasers |
Purchasers | ![]() Providers
Providers
Government Regulation and Guidance
Medicaid and Children’s Health Insurance Program
Managed Care Access, Finance and Quality Final Rule
Initiative Description: On April 22, 2024, Medicaid and Children’s Health Insurance Program (CHIP) finalized two key regulations: “Ensuring Access to Medicaid Services” (Access Rule) and “Medicaid, CHIP Managed Care Access, Finance, and Quality” (Managed Care Rule), aimed at improving access to care in Medicaid across delivery systems (fee-for-service and managed care) and authorities (state plan and waiver services). The Managed Care Rule addresses five primary areas: (1) access in managed care, including network adequacy, (2) state directed payments, (3) medical loss ratio standards, (4) in lieu of services and settings (ILOSs), and (5) quality and performance assessment.
Strategic and Tactical Uses: The new rule will improve how managed care plans serve their members. Plans will need to collaborate closely with providers to implement the requirements of the rule.
Multi-payer Alignment Foundational Element: Aligning Key Payment Model Components, Timely and Consistent Data Sharing
Timeframe: Active
For additional information, please visit https://www.medicaid.gov/medicaid/
managed-care/guidance/medicaid-and-chip-managed-care-final-rules/
index.html
Who Might Use This: ![]() Health Plans |
Health Plans | ![]() Providers |
Providers | ![]() Policy Makers
Policy Makers
![]()
Government Regulation and Guidance
Alternative Payment Model Performance Pathway
Initiative Description: The Alternative Payment Model (APM) Performance Pathway (APP) is an optional Merit-based Incentive Payment System (MIPS) reporting and scoring pathway for MIPS-eligible clinicians who are also participants in MIPS APMs. Performance is measured across three areas: quality, improvement activities, and promoting interoperability. The idea behind the measure set is to reduce burden, create new scoring opportunities for participants in MIPS APMs, and encourage participation in APMs through alignment.
Strategic and Tactical Uses: APM entities in a MIPS APM may report the APP on behalf of their MIPS-eligible clinicians. Accountable Care Organizations (ACOs) participating in the Medicare Shared Savings Program are required to report the APP for the purpose of assessing their quality performance for that program. Groups and individuals may also report the APP on behalf of their MIPS-eligible clinicians.
Multi-payer Alignment Foundational Element: Aligning Key Payment Model Components, Performance Measurement and Reporting
Timeframe: Active
For additional information, please visit https://qpp.cms.gov/mips/apm-performance-pathway
Who Might Use This: ![]() Providers
Providers
Collaboratives and Innovative Partnerships
Arkansas’s Multi-state, Multi-payer Collaborative
Initiative Description: Since 2011, Arkansas Blue Cross and Blue Shield, Blue Cross and Blue Shield of Kansas City, and Blue Cross and Blue Shield of Oklahoma (BCBS health plans) have engaged in a regional, multi-payer learning and technical assistance effort. The effort started as an initiative to stay connected, share lessons learned, and demonstrate best practices related to the Comprehensive Primary Care Initiative, but now the Collaborative has spanned two additional Innovation Center models (Comprehensive Primary Care Plus and Primary Care First). The multi-state effort has continued to grow organically beyond the models and BCBS health plans.
Strategic and Tactical Uses: Regional health plans in Arkansas, Oklahoma, and the Kansas City area participate in the multi-state, multi-payer Collaborative and are involved in alignment efforts for quality measures, technical assistance, and information exchange. Health plans outside of the area can use the collaborative as an example of regional plans coming together to align and can explore forming a Collaborative in their own region.
Multi-payer Alignment Foundational Element: Performance Measurement and Reporting, Whole Person Care, Timely and Consistent Data Sharing, Providing and Leveraging Technical Assistance
Timeframe: Active
For additional information, please email Alicia Berkemeyer (amberkemeyer@arkbluecross.com) or Adam Whitlock (mawhitlock@arkbluecross.com).
Who Might Use This: ![]() Health Plans
Health Plans
Government Regulation and Guidance
2025 Hospital Inpatient Prospective Payment System and Long-Term
Care Hospital Prospective Payment System Final Rule
Initiative Description: On August 1, 2024, the Centers for Medicare & Medicaid Services (CMS) issued the fiscal year (FY) 2025 Medicare hospital inpatient prospective payment system (IPPS) and long-term care hospital prospective payment system (LTCH PPS) final rule.
Strategic and Tactical Use: The new rule will update Medicare fee-for-service payment rates and policies for inpatient hospitals and LTCHs for FY 2025. CMS is publishing this final rule to meet the legal requirements to update Medicare payment policies for IPPS hospitals and LTCHs on an annual basis.
Multi-payer Alignment Foundational Element: Aligning Key Payment Model Components
Timeframe: Active
For additional information, please visit https://www.cms.gov/newsroom/fact-sheets/fy-2025-hospital-inpatient-prospective-payment-system-ipps-and-long-term-care-hospital-prospective
Who Might Use This: ![]() Health Plans |
Health Plans | ![]() Providers
Providers
Innovative Initiatives and Partnerships
Core Quality Measures Collaborative Measure Sets
Initiative Description: The Core Quality Measures Collaborative (CQMC) develops and releases core sets of quality measures for 10 focus areas. The CQMC Workgroups convene on an annual basis to update the existing core sets, conduct yearly maintenance, and dialogue with members from a variety of stakeholder groups to gain different perspectives on the measures and consider new ones.
Strategic and Tactical Uses: Organizations can compare the CQMC Measures Collaborative Core Measure Sets with other aligned measure sets in use to identify overlap and prioritize measures for multi-payer implementation initiatives.
Multi-payer Alignment Foundational Element: Performance Measurement
Timeframe: Active
For additional information, please visit https://www.qualityforum.org/CQMC_Core_Sets.aspx
Who Might Use This: ![]() Payers |
Payers | ![]() Providers |
Providers | ![]() Purchasers
Purchasers
Collaboratives and Innovative Partnerships
California Health and Human Services
Data Exchange Framework
Initiative Description: The Data Exchange Framework (DxF) is an agreement across health and human services systems and providers to share information safely and effectively. The Framework aims to make data available to drive decisions and outcomes, promote individual data access, reinforce data privacy and security, and establish clear and transparent terms and conditions for data collection, exchange, and use. Starting January 2024, health care entities are required to exchange real-time information with each other and with public health and social services for treatment, payment, and health care operations.
Strategic and Tactical Uses: California organizations are required to use the Framework to communicate with each other regarding the sharing of patient data. States outside of California can apply a similar data exchange framework to improve data sharing for their own populations.
Multi-payer Alignment Foundational Element: Timely and Consistent Data Sharing
Timeframe: Active
For additional information, please visit https://www.cdii.ca.gov/committees-and-advisory-groups/data-exchange-framework/
Who Might Use This: ![]() Health Plans |
Health Plans | ![]() Purchasers |
Purchasers | ![]() Providers |
Providers | ![]() Policy Makers |
Policy Makers | ![]() Community-Based Organizations |
Community-Based Organizations | ![]() Enabling Organizations
Enabling Organizations
The Alignment Landscape includes a search bar and three filters to help narrow down items that are relevant to your alignment goals.
Filters:
![]() The Timeframe section
The Timeframe section
filters by upcoming, active and archived opportunities and resources:

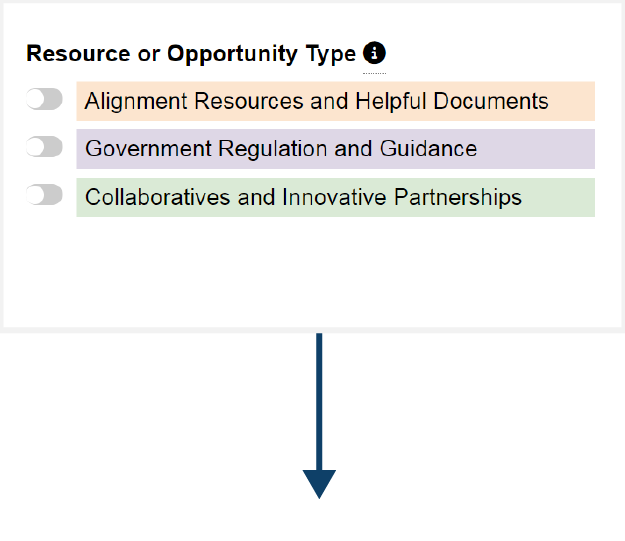
![]() The Resource or Opportunity Type section filters by initiatives and resources which are categorized into the following three groups:
The Resource or Opportunity Type section filters by initiatives and resources which are categorized into the following three groups:
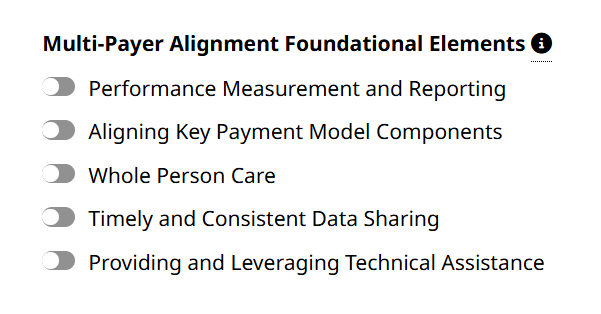
![]() The Multi-Payer Alignment Foundational Elements section filters by key features of multi-payer initiatives, defined by the Duke-Margolis Institute for Health Policy.
The Multi-Payer Alignment Foundational Elements section filters by key features of multi-payer initiatives, defined by the Duke-Margolis Institute for Health Policy.
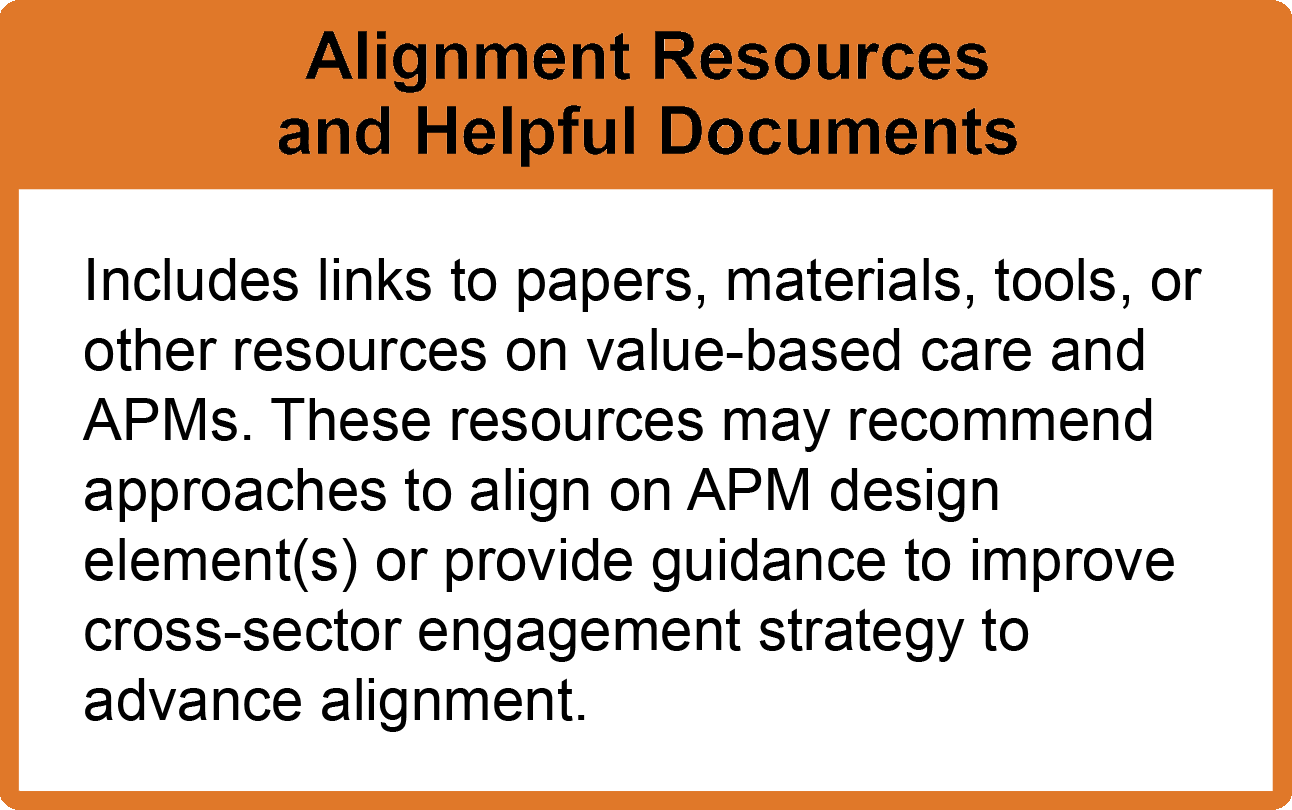
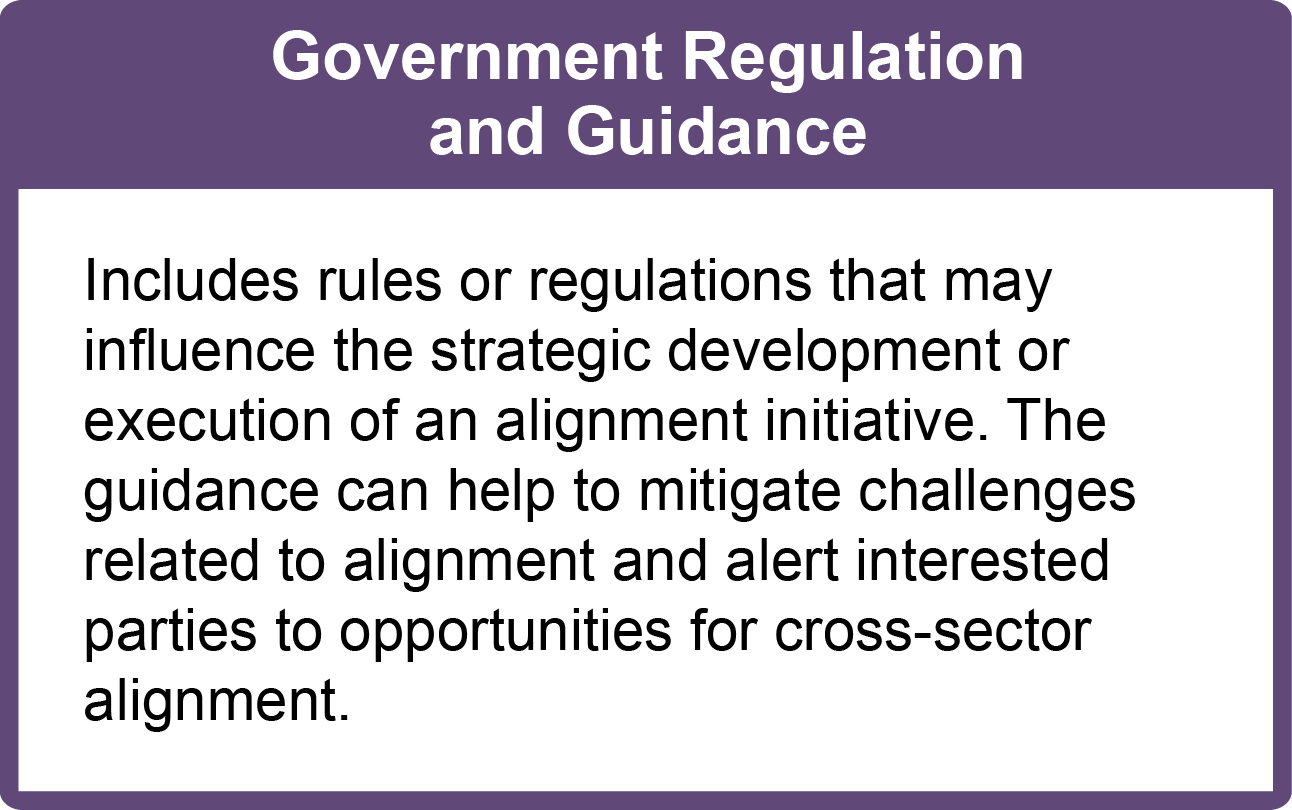
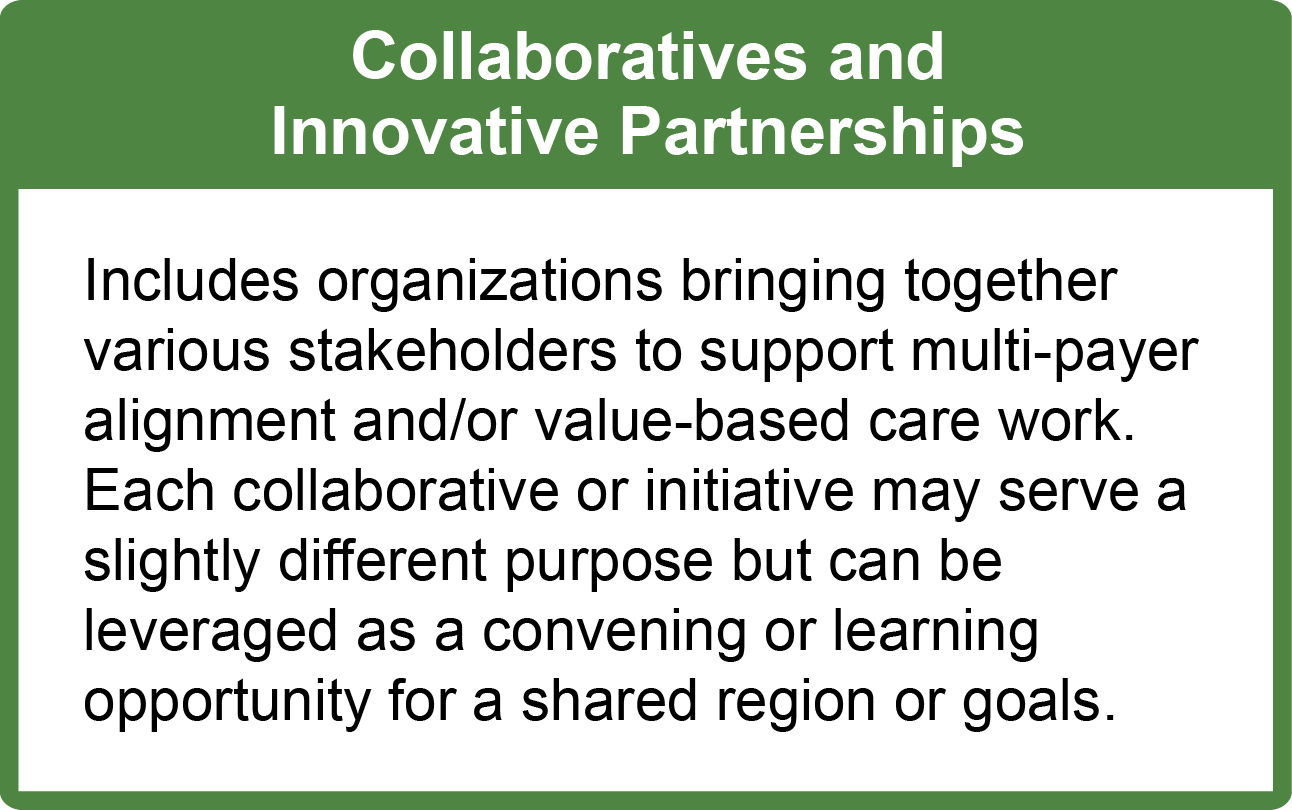
Each card includes background information on the alignment opportunity, including anticipated strategic and tactical uses and audience, associated foundational element(s), timeframe, and where to find additional information.
The Alignment Landscape includes a search bar and three filters to help narrow down items that are relevant to your alignment goals.
Filters:
![]()
The Timeframe section filters by new, upcoming and archived opportunities and resources:

![]()
The Resource or Opportunity Type section filters by initiatives and resources which are categorized into the three following groups:


![]()
The Multi-payer Alignment Foundational Elements section filters by the Accountable Care Curve Measurement.
Download accessible PDF of 2023 APM Measurement Report
Measurement Track: Multi-stakeholder Alignment & Design
![]()
![]()
![]()
![]()
Capability: Cohesive digital referral and management platform
Measurement Track: Multi-stakeholder Alignment & Design
![]()
![]()
![]()
![]()
Capability: Develop regional collaboration approach to drive alternative payment model movement
Definition:
Establish forums for organizations across the health care ecosystem, including providers, health plans, community-based organizations (CBOs), state/local governments, and employers, to come together to collectively address health care challenges.
Measurement Track: Multi-stakeholder Alignment & Design
![]()
![]()
![]()
Capability: Implement interoperable data exchange/electronic clinical quality measures
Definition:
Identify and implement mechanisms, such as health information exchanges, to improve the ability to share data across the care continuum and across independent organizations to enable greater transparency into gaps in care and establish longitudinal patient records. Consider the needs of both employed and affiliated providers in designing potential solutions to enable interoperability across the largest number of stakeholders possible.
Resources:
Measurement Track: Multi-stakeholder Alignment & Design
![]()
![]()
![]()
![]()
Capability: Create appropriate partnerships and initiatives to address the needs of historically underserved populations with complex needs
Definition:
Identify and establish partnerships which supplement existing service, capability or other known gaps to more comprehensively address the needs of historically underserved populations with complex needs. Partnerships could be evaluated based on findings from the community health needs assessment, applicability to the disease states most prevalent in the community, and/or ability to provide non-traditional health care services such as transportation to address known health care disparities more holistically.
Resources:
Measurement Track: Multi-stakeholder Alignment & Design
![]()
![]()
![]()
![]()
Capability: Build qualitative indicators for multi-stakeholder network success
Definition:
Identify success indicators and set short-and long-term goals.
Measurement Track: Multi-stakeholder Alignment & Design
![]()
![]()
![]()
![]()
Capability: Conduct community health needs assessment focused on historically underserved populations with complex needs
Definition:
Targeted assessment focused on historically underserved populations with complex needs in the community to identify potential gaps and required interventions.
Measurement Track: Multi-stakeholder Alignment & Design
![]()
![]()
![]()
![]()
Capability: Organize/join network of local and diverse stakeholders to identify and design community health goals
Definition:
Assemble local stakeholders to start aligning on common goals and share individual organizational promising practices.
Resources:
Measurement Track: Multi-stakeholder Alignment and Design
![]()
![]()
![]()
![]()
Capability: Analysis of community organizations and partnerships for underserved populations
Definition:
Identify community-based organizations, or similar entities, which promote improvements in the health and well-being of individuals in local communities. Analyze these organizations to understand the shared populations served and identify where partnership opportunities may exist to promote patient education, provide additional support for underserved populations, and share data.
Resources:
Measurement Track: Multi-stakeholder Alignment and Design
![]()
![]()
![]()
![]()
Capability: Ability to assess current ecosystem (alignment framework inclusion in strategic planning)
Definition:
Gain an understanding of the various stakeholders that exist across the health care ecosystem which play a role in promoting and maintaining wellness beyond the traditional health care delivery assets. Utilize patient journey maps or other tools to educate clinicians, staff, and administrators on the role they play in the broader ecosystem.
Resources:
Measurement Track: Multi-stakeholder Alignment and Design
![]()
![]()
![]()
![]()
Capability: Develop multi-disciplinary education and coaching on value of accountable care
Definition:
All stakeholders understand the importance of accountable care and understand their role in achieving outcome targets.
Resources:
Measurement Track: Multi-stakeholder Alignment and Design
![]()
![]()
![]()
![]()
Capability: Align incentives across organizational leadership and provider network
Definition:
Cascading of incentives down to all providers within the organization supports knowledge of inclusion in quality measurement and performance monitoring. Promotes team-based framework of inter-disciplinary collaboration.
Resources:
Measurement Track: Multi-stakeholder Alignment and Design
![]()
![]()
![]()
![]()
Capability: Coordinated patient-centric partnerships that serve as foundation for multiple commercial and governmental payer products
Definition:
Applying promising practices identified from coordinated care delivery and incorporating into a standardized approach with payer products.
Measurement Track: Multi-stakeholder Alignment and Design
![]()
![]()
![]()
Capability: Ability to conduct provider stratification
Definition:
Identification and stratification of providers serving historically underserved patient populations and/or populations with complex needs to find opportunities to target interventions at specific provider locations to maximize impact.
Resources:
Measurement Track: Multi-stakeholder Alignment and Design
![]()
![]()
![]()
Capability: Develop patient-centric coordinated partnerships
Definition:
Collaborate across primary and specialty care on coordinated patient-centered care delivery.
Resources:
Measurement Track: Multi-stakeholder Alignment and Design
![]()
![]()
![]()
![]()
Capability: Provider performance incentive alignment
Definition:
Evaluate existing provider compensation models and identify opportunities to establish variable compensation based on metrics other than volume. Socialize plans with provider leadership to gain buy-in and pilot the use of new compensation models with providers who see greater number of patients in alternative payment models. Utilize pilot learnings to develop enterprise-wide approach to transforming provider compensation to be better aligned with the financial and clinical outcomes sought in alternative payment models.
Resources:
Measurement Track: Multi-stakeholder Alignment and Design
![]()
![]()
![]()
![]()
Capability: Enhanced provider coordination across levels, intensity, and continuum of care
Definition:
Coordinated patient-centered care delivery incorporating all levels of care including home- and community-based providers.
Resources:
Measurement Track: Multi-stakeholder Alignment & Design
![]()
![]()
![]()
Capability: Create accountable care organization (ACO) for defined payment population
Definition:
Initiate a shared risk and incentive model for a specific patient population to facilitate movement toward value-based care payment models.
Measurement Track: Multi-stakeholder Alignment and Design
![]()
![]()
![]()
Capability: Develop network development strategy to improve adequacy gaps
Definition:
Create a strategy and actionable interventions to improve network adequacy using identified gaps from provider network adequacy analysis.
Measurement Track: Multi-stakeholder Alignment and Design
![]()
![]()
![]()
![]()
Capability: Implement provider performance reporting
Definition:
Create provider scorecards, dashboards, or other tools to track and monitor provider performance. Measures utilized should address quality, cost, access, and other relevant domains that are included in, or related to, current and planned alternative payment models. Providers should receive periodic feedback on their performance, including direction on how to improve. Consider publishing performance data within the organization to encourage sharing of promising practices.
Resources:
Measurement Track: Multi-stakeholder Alignment and Design
![]()
![]()
![]()
![]()
Capability: Identify organizational incentive-based performance
Definition:
Incentivize organizational stakeholders to collaborate and be held responsible for their role in moving towards an accountable care model.
Resources:
Measurement Track: Multi-stakeholder Alignment and Design
![]()
![]()
![]()
![]()
Capability: Develop strategy for market supply and analysis
Definition:
Determine market supply gaps within network of employed and independent primary and specialty provider groups.
Resources:
Measurement Track: Multi-stakeholder Alignment and Design
![]()
![]()
![]()
Capability: Develop strategy for provider network adequacy analysis
Definition:
Establish criteria and metrics for evaluating network adequacy on an ongoing basis, including capacity, timely access, specialties, and geographic coverage. Perform a preliminary analysis to identify gaps and establish a strategy for addressing those gaps over time.
Resources:
Measurement Track: Multi-stakeholder Alignment and Design
![]()
Transforming stage supports transparent multi-stakeholder alignment and forward-thinking infrastructure that advances accountable care models and arrangements.
Measurement Track: Multi-stakeholder Alignment and Design
![]()
Aligning stage supports multi-stakeholder participation in advancing accountable care models and arrangements with measurable progress.
Measurement Track: Multi-stakeholder Alignment and Design
![]()
Investing stage supports investing in multi-stakeholder performance and consensus-generating groups that allow for facilitation, relationship-building, and multi-stakeholder ownership of and accountability for the achievement of health goals.
Measurement Track: Multi-stakeholder Alignment and Design
![]()
Learning stage supports identifying opportunities available to educate multiple stakeholders on the existing accountable care landscape.
Measurement Track: Data and Infrastructure
![]()
![]()
![]()
![]()
Capability: Enhanced usage of enterprise software
Definition:
Utilization of enterprise software such as data warehouses to capture, store, and analyze multiple types of data at once (e.g., clinical, claims, quality, financial data).
Measurement Track: Data and Infrastructure
![]()
![]()
![]()
![]()
Capability: Develop technology infrastructure to support advanced consumer tools
Definition:
Ability to capture and incorporate data from remote patient monitoring devices, telehealth services, and consumer wearables (including phones, etc.).
Resources:
Measurement Track: Data and Infrastructure
![]()
![]()
![]()
![]()
Capability: Leverage interoperable data exchange
Definition:
May include the usage of a regional Health Information Exchange (HIE) or other tools that facilitate the exchange of multiple types and formats of data between organizations.
Resources:
Measurement Track: Data and Infrastructure
![]()
![]()
![]()
Capability: EHR incorporates digital integration with community and social services
Definition:
Ability of EHR to capture and communicate with community or social services tools and systems for sharing of data and referrals.
Measurement Track: Data and Infrastructure
![]()
![]()
![]()
![]()
Capability: Leverage clinical natural language processing (cNLP) to optimize medical record data capture
Definition:
Utilization of cNLP to assist with comprehensive clinical data capture and categorization to inform population health risk stratification, input to chronic disease registries, and identify care gaps.
Measurement Track: Data and Infrastructure
![]()
![]()
![]()
![]()
Capability: Sending, receiving, and reconciling data from multiple/aggregated sources
Definition:
Ability to send and receive clinical, claims, and other various data (including SDOH). May also include Health Information Exchange (HIE), usage of APIs to share data between disparate systems, and other interoperable data exchange types.
Resources:
Measurement Track: Data and Infrastructure
![]()
![]()
![]()
![]()
Capability: Access to electronic health records (EHR) across and between organizations
Definition:
Ability of multiple types of users across the organization to access clinical data to develop corresponding analytics for care management and reporting.
Resources:
Measurement Track: Data and Infrastructure
![]()
![]()
![]()
![]()
Capability: Enhanced member/patient portals
Definition:
Usage of the portal to further capture and communicate enhances/additional services and activities such as online scheduling or provider bidirectional messaging.
Measurement Track: Data and Infrastructure
![]()
![]()
Capability: Leverage claims system that accommodates alternative payment models (APMs)
Definition:
Implementation and utilization of a claims system which can process payments beyond fee-for-service, without manual workarounds.
Measurement Track: Data and Infrastructure
![]()
![]()
![]()
Capability: Implement member/patient portals (lab, immunization, etc.)
Definition:
Establish an online portal for members and patients to perform basic tasks such as reviewing medical information, paying bills, and other administrative functions. Where applicable, consolidate instances of online portals that exist across the care continuum (e.g., separate portals for inpatient and outpatient services).
Resources:
Measurement Track: Data and Infrastructure
![]()
![]()
![]()
Capability: Develop integrated electronic health records (EHRs)
Definition:
Inclusion of multiple care types – primary, specialty, behavioral health, acute, etc. – within the EHR for comprehensive member/patient and provider/coordinator view.
Resources:
Measurement Track: Data and Infrastructure
![]()
![]()
![]()
![]()
Capability: Implement enterprise software approach
Definition:
Implementation and usage of several enterprise-wide software/tools such as data warehouse, clinical decision support, security, and privacy to enable the collection, analysis, and reporting needs in other Measurement Tracks.
Measurement Track: Data and Infrastructure
![]()
![]()
![]()
![]()
Capability: Implement member/patient portal (demographic)
Definition:
Implementation and usage of a patient portal to capture and communicate demographic data between the payer, provider, and member/patient.
Resources:
Measurement Track: Data and Infrastructure
![]()
![]()
![]()
![]()
Capability: Implement electronic health records (EHR)
Definition:
Implementation and usage of an EHR to capture medical records and other clinical data for usage in reporting.
Measurement Track: Data and Infrastructure
![]()
![]()
![]()
Capability: Population risk stratification and registries
Sub-capability: Value based contract insights identified across sub-populations utilized to improve quality, outcomes, utilization, and performance
Measurement Track: Data and Infrastructure
![]()
![]()
![]()
Capability: Population risk stratification and registries
Sub-capability: Analytics reporting includes insights generated from the addition of clinical, financial, and business considerations
Measurement Track: Data and Infrastructure
![]()
![]()
![]()
Capability: Population risk stratification and registries
Definition:
Utilize multiple data sources (e.g., clinical, claims, SDOH, consumer behavior patterns) combined with public health registries to perform predictive analytics to identify/stratify individuals and populations with the highest addressable risk. Utilize various inputs and weights, which are periodically refined, to develop a composite risk score to compare relative risk of members/patients across the panel.
Resources:
Measurement Track: Data and Infrastructure
![]()
![]()
![]()
Capability: Create chronic disease registries with electronic health records (EHR) and claims-based data
Definition:
Participation in clinical registries is a critical component of quality outcomes reporting.
Resources:
Measurement Track: Data and Infrastructure
![]()
![]()
![]()
Capability: Analytics rules engine with multidimensional identification and stratification modeling
Definition:
Building on the initial Analytics Rules Engine to utilize multiple data sources (e.g., claims, clinical, social determinants of health (SDOH)) in the performance of advanced reporting and identification of members/patients from historically underserved populations with complex needs for care management and interventions.
Measurement Track: Data and Infrastructure
![]()
![]()
![]()
![]()
Capability: Comparative and benchmarked performance reporting across all alternative payment model contracts
Definition:
Utilization of multiple data sources (e.g., clinical, claims, SDOH) to report and analyze contracts individually, compared to others, and compared to benchmarks.
Resources:
Measurement Track: Data and Infrastructure
![]()
![]()
![]()
Capability: Leverage employer and administrative services only (ASO) reporting
Sub-capability: Insights identified in employer and ASO reports utilized for improved quality, outcomes, and utilization
Measurement Track: Data and Infrastructure
![]()
![]()
![]()
![]()
Capability: Leverage employer and administrative services only (ASO) reporting
Definition:
Develop reporting specifically for self-insured entities, such as employer groups, where the health plan serves in an ASO capacity. Reporting should provide insights on utilization trends and patterns, areas of high expenditures, common health conditions, and cost containment strategies. Additional insights may be provided in areas such as employee engagement (e.g., utilization of preventative services), benchmarking, and pharmacy (e.g., use of generics vs. branded drugs).
Measurement Track: Data and Infrastructure
![]()
![]()
![]()
![]()
Capability: Develop quality, outcomes, financial, and utilization reporting
Definition:
Includes regular data sharing, of multiple types of data (e.g., clinical, claims, social determinants of health (SDOH)) between organizations throughout the performance year to support accurate and timely analysis for impactable interventions.
Measurement Track: Data and Infrastructure
![]()
![]()
![]()
Capability: Implement hierarchical condition category/risk stratification
Definition:
Ability to utilize claims and clinical data to analyze conditions as well as apply risk and rating for basic identification of high and rising-risk members/patients.
Resources:
Measurement Track: Data and Infrastructure
![]()
![]()
![]()
Capability: Leverage analytics rules engine
Definition:
Consumes raw data to apply and execute a defined logical rule set to create meaningful output that can be further analyzed to develop actionable next steps.
Measurement Track: Data and Infrastructure
![]()
![]()
![]()
![]()
Capability: Implement performance reporting by individual alternative payment model contract
Definition:
Ability to utilize data captured to see performance measures and metrics of a specific provider contract.
Resources:
Measurement Track: Data and Infrastructure
![]()
![]()
![]()
![]()
Capability: Leverage quality, financial, and utilization reporting
Definition:
Ability to utilize singular source of data captured for quality, financial, and utilization reporting individually and across contracts.
Resources:
Measurement Track: Data and Infrastructure
![]()
![]()
![]()
![]()
Capability: Implement singular source of data capture
Definition:
Relevant source systems used to capture important data elements have been identified and are under the purview of the data management structure. Instances where the same data is being captured in multiple locations (e.g., different fields within the EHR) are being identified and a process exists to standardize the inputs received for use in reporting.
Measurement Track: Data and Infrastructure
![]()
![]()
![]()
![]()
Capability: Develop data strategy structure and governance
Definition:
Relevant data sets across financial, clinical, and operational domains have been identified and are in the process of being ingested into a single enterprise data warehouse or similar solution to enable data from disparate sources to be aggregated and used in analytics. A governance model has been established to drive standardized data definitions as part of a formal data management process and a formal intake process for analytics requests is established.
Resources:
Measurement Track: Data and Infrastructure
![]()
Aligning stage supports participation in broader data-sharing activities and patient/consumer engagement in their own care.
Measurement Track: Data and Infrastructure
![]()
Investing stage supports investment in improved data collection, analytics, and measurement outcomes.
Measurement Track: Data and Infrastructure
![]()
Learning stage supports development of data management and governance necessary for infrastructure to support analytics and insights development.
Measurement Track: Quality
![]()
![]()
![]()
![]()
Capability: Medical policy transparency
Definition:
Make all medical policies available to the provider community online and in other formats as needed. A member/patient-focused version of the medical policies is available for their review as well.
Measurement Track: Quality
![]()
![]()
![]()
Capability: Transformed utilization management with AI-assisted clinical reviews with provider/payer interoperability
Definition:
Using the latest AI capabilities to pre-populate authorization submissions with the mandated data elements. Includes implementation of FHIR API standards.
Resources:
Measurement Track: Quality
![]()
![]()
![]()
![]()
Capability: Improve outcomes through sharing and discussing quality metrics
Definition:
Application of quality performance results with provider groups to drive process and outcomes improvements across clinical, cost, and utilization metrics, and drive improvements with contracted metrics between providers and plans or CMS.
Measurement Track: Quality
![]()
![]()
![]()
![]()
Capability: Ongoing monitoring of low-value care
Definition:
Incorporating low-value care monitoring and analysis into ongoing quality performance reviews and comparisons of volumes of low-value services by provider/practice.
Measurement Track: Quality
![]()
![]()
![]()
![]()
Capability: Develop inclusive medical policies
Definition:
All policies include rationale for the mandate based on industry standards and evidence-based promising practices.
Measurement Track: Quality
![]()
![]()
![]()
![]()
Capability: Leverage quality standards and benchmarks for top performance
Definition:
Using top performance benchmarks and quality standards to show gaps in performance and to align quality improvement plan targets.
Measurement Track: Quality
![]()
![]()
![]()
![]()
Capability: Utilizes insights from reporting to support provider specific and system improvements
Definition:
Application of blinded quality performance results comparisons between individual providers to drive provider-specific process improvements.
Measurement Track: Quality
![]()
![]()
![]()
Capability: Leverage gold carding in utilization management
Definition:
Develop artificial intelligence (AI)-assisted utilization management programs and gold carding standards of performance and allow top performing practices a reprieve from authorization submission to increase clinical review efficiency and accuracy, as well as reduce administrative burden.
Measurement Track: Quality
![]()
![]()
![]()
Capability: Clinician leadership receives quality outcomes and participates in results’ interpretation and improvement efforts
Definition:
Ensuring clinical stakeholders participate in outcomes discussions to determine interventions and next steps.
Measurement Track: Quality
![]()
![]()
![]()
![]()
Capability: Develop approach to address low-value care
Definition:
Approach may include focus on appropriateness of care that is anchored in improving outcomes (evidence-based promising practices).
Measurement Track: Quality
![]()
![]()
![]()
![]()
Capability: Develop standardized medical policies across population
Definition:
Configuration of medical policies’ guidelines to be applicable for entire population instead of specific sub-populations. Eases burden on providers to determine applicability of medical policies for specific patient types.
Measurement Track: Quality
![]()
![]()
![]()
![]()
Capability: Enhancements to utilization management to reduce barriers to care
Definition:
Includes continual re-evaluation of prior authorization list to eliminate low-value/non-standard sub-categories and electronic submissions.
Measurement Track: Quality
![]()
![]()
![]()
![]()
Capability: Identify low-value care
Definition:
Services that provide little or no benefit to patients, have potential to cause harm, incur unnecessary costs to patients, or waste limited health care resources. The identification of these types of services/care should be a data-driven process.
Resources:
Measurement Track: Quality
![]()
![]()
![]()
![]()
Capability: Develop medical policy review approach
Definition:
Collection and clinical review of medical records and related information for specific conditions/procedures against predefined guidelines and requirements.
Measurement Track: Quality
![]()
![]()
![]()
![]()
Capability: Develop utilization management approach
Definition:
Framework to evaluate medical necessity, appropriateness and efficiency of health care services, procedures, and facilities.
Resources:
Measurement Track: Quality
![]()
![]()
![]()
![]()
Capability: Promote evidence-based decisions and support
Definition:
Understanding the value and purpose of effective decision-making by leveraging data analysis and information. Putting support systems in place to support compliance and inter-rater reliability.
Resources:
Measurement Track: Quality
![]()
![]()
![]()
![]()
Capability: Develop organizational quality management program
Sub-capability: Measurement framework
Definition:
Awareness of the organizational approach/framework on quality measurement that will be used for consistent monitoring and comparison year over year.
Measurement Track: Quality
![]()
![]()
![]()
![]()
Capability: Develop organizational quality management program
Sub-capability: Quality improvement assessments
Definition:
Processes that include testing acceptance/adherence to new/revised practices, determining how the new practices are affecting the delivery of patient-centered care, and assessment of how much patient care is improving.
Measurement Track: Quality
![]()
![]()
![]()
![]()
Capability: Develop organizational quality management program
Definition:
Standardize processes and structure to reduce variation, achieve predictable results, and improve outcomes for patients, health care systems, and organizations. Structures may include technology, culture, and leadership.
Resources:
Measurement Track: Quality
![]()
![]()
![]()
![]()
Capability: Coordinate clinical quality and performance metrics across governmental and commercial health plans enabling synergistic improvements in health outcomes
Definition:
Develop comparisons of quality results from different organizations and/or populations to look for promising practices that can be applied to other organizations/populations.
Measurement Track: Quality
![]()
![]()
![]()
![]()
Capability: Enhanced utilization, financial, quality, and outcomes reporting across sub-populations
Definition:
Aggregated from multiple populations/sub-populations to identify multi-dimensional ties between quality, financial, and utilization results.
Measurement Track: Quality
![]()
![]()
![]()
![]()
Capability: Incorporation of patient-reported outcomes into performance reporting
Definition:
Measures developed to include outcome data collected directly from patients (e.g., patient-reported blood pressure or A1c through monitoring devices and programs).
Measurement Track: Quality
![]()
![]()
![]()
![]()
Capability: Provide transparent quality benchmarking methodology
Definition:
Methodology is shared with regulators and providers, and must be adjusted for population mix, risk (including social determinants of health), and market (e.g., mammogram rates may be lower in certain communities with low access to preventative care). Also includes participation in chronic condition clinical registries identifying and tracking care and outcomes.
Resources:
Measurement Track: Quality
![]()
![]()
![]()
![]()
Capability: Develop key performance indicator management and alignment
Definition:
Aligning on what key performance indicators the organization will focus on as well as tools to monitor results with actionable interventions.
Measurement Track: Quality
![]()
![]()
![]()
![]()
Capability: Engage and collaborate with provider leadership in reconciling perceived conflicts between clinical quality and governmental and health plan performance quality metrics
Definition:
Ensuring that provider/clinical stakeholders are included in quality measure definition/specification development, analysis, reporting, and resolving potential conflicts early in the performance review period in order to positively impact outcomes (e.g., different definitions and targets for diabetes management across HEDIS, provider, and health plan).
Measurement Track: Quality
![]()
![]()
![]()
Capability: Encourage provider-specific reporting incorporating quality, utilization, financial outcomes, and benchmark comparisons
Definition:
Ensuring that quality reporting includes multiple sources of measurement and comprehensive assessment within a defined provider network/group with comparisons across providers to identify promising practices and successful intervention methods.
Measurement Track: Quality
![]()
![]()
![]()
Capability: Aggregate quality reporting incorporating utilization, sites of service, and patient outcomes
Definition:
Inclusion of multiple sources and types of quality data for well-rounded measurement that captures the impact that quality initiative(s) had on all aspects of care.
Resources:
Measurement Track: Quality
![]()
![]()
![]()
![]()
Capability: Reporting of patient-reported outcomes (PROs)
Definition:
Effective collection and analysis of patient-reported outcomes by the provider or health plan, including measurement of health disparities; timely collection and use of alternative collection methods (e.g., mobile devices).
Resources:
Measurement Track: Quality
![]()
![]()
![]()
![]()
Capability: Collection of patient-reported outcomes (PROs)
Definition:
Report of the status of a patient’s health conditions that comes directly from the patient to a provider or the health plan, without interpretation of the patient’s response by a clinician or anyone else. Examples of patient self-reported data collection tools include Patient-Reported Outcomes Measurement Information System (PROMIS), Medicare Health Outcomes Survey, and FOTO Patient Outcomes.
Measurement Track: Quality
![]()
![]()
![]()
![]()
Capability: Encourage adoption of pay-for-performance
Definition:
Developing an incentive structure to demonstrate successful achievement of defined process and clinical/preventative measures, as well as earn shared savings and/or reward/bonus payments.
Resources:
Measurement Track: Quality
![]()
![]()
![]()
Capability: Encourage adoption of pay-for-reporting
Definition:
Track and encourage participation in pay-for-reporting programs which provide incentives for providers to report quality, cost, or other data to a commercial or government health plan, regardless of performance. Utilize these programs to familiarize providers with the types of measures which ultimately will be tied to payment rates or bonuses in the future and begin to take actions to remediate poor performance. Review performance data received from the Quality Payment Program and other CMS models which have elements of pay-for-reporting.
Resources:
Measurement Track: Quality
![]()
Transforming stage supports using standardized system-wide processes and tools to predict populations with gaps in care needs to drive interventions and improve patient experience as well as drive high-quality care and improved outcomes for all.
Measurement Track: Quality
![]()
Aligning stage supports benchmarking quality performance results and executing on strategic initiatives to improve outcomes toward person-centered care. Supports aligning to core measure sets across industry/stakeholder groups.
Measurement Track: Quality
![]()
Investing stage supports establishing evidence-based quality goals with ongoing data collection for measuring improvement and progress toward goals.
Measurement Track: Quality
![]()
Learning stage supports recognition of standard quality metrics and current state of quality performance.
Measurement Track: Payment Reform
![]()
![]()
![]()
![]()
Capability: Continuous improvement outputs based on insights and target performance
Definition:
Improvement initiatives are generated from understanding the actual performance to defined metrics and associated targets.
Resources:
Measurement Track: Payment Reform
![]()
![]()
![]()
![]()
Capability: Financial incentive alignment across organizational leadership and providers focused on accountable care
Definition:
Compensation and/or incentive opportunities align organizational goals to the level of individual provider/practitioner across clinical delivery and leadership teams to optimize improvement capture.
Resources:
Measurement Track: Payment Reform
![]()
![]()
Capability: Integrated financial and clinical team actively engaged to incorporate clinical perspectives with data outputs to identify insights and target performance improvement opportunities
Definition:
Clinical and financial data are reviewed together to capture understanding of cost, utilization, quality, and outcomes relative to metric targets.
Resources:
Measurement Track: Payment Reform
![]()
![]()
![]()
![]()
Capability: Leveraging multiple reports (integrated clinical, claims, quality, and financial data)
Definition:
Reporting includes information captured from electronic health records, claims-based records, quality analysis, and financial sources.
Measurement Track: Payment Reform
![]()
![]()
![]()
![]()
Capability: Manage financial reconciliation
Definition:
Process of making financial payments consistent with payment methodology, typically at the end of a defined period, e.g., annually.
Measurement Track: Payment Reform
![]()
![]()
![]()
Capability: Development of contract management platform
Definition:
System to organize, track, and monitor contracting terms, performance metrics, and payment methodology across contracts with payers and providers.
Measurement Track: Payment Reform
![]()
![]()
Capability: Network performance and reporting management
Definition:
Demonstration of a defined provider network’s performance to a set of pre-defined metrics with targets.
Measurement Track: Payment Reform
![]()
![]()
![]()
![]()
Capability: Collaboration across organizational leadership (e.g., financial, contracting, and operations) to align metrics and performance management
Definition:
Review the existing bundled alternative payment model portfolio and develop performance metrics which take into consideration requirements for quality, cost, and other factors. Performance metrics should be included in organization-wide scorecards or other performance management programs to align incentives and goals. A selection of these measures may also be considered for use in provider compensation models.
Resources:
Measurement Track: Payment Reform
![]()
![]()
![]()
![]()
Capability: Leverage reports to identify opportunities to capture shared savings
Definition:
Document detailing focus areas for meeting defined target metrics to achieve shared savings’ potential.
Resources:
Measurement Track: Payment Reform
![]()
![]()
![]()
![]()
Capability: Develop financial risk management platform
Definition:
System to organize, track, and monitor organizational financial capture of bonuses to target opportunity for defined performance metrics.
Resources:
Measurement Track: Payment Reform
![]()
![]()
![]()
![]()
Capability: Reporting of monitor targets and performance
Definition:
Includes stratified and risk adjusted performance measures.
Measurement Track: Payment Reform
![]()
![]()
![]()
![]()
Capability: Enhanced physician education and coaching (including provider network collaboration)
Definition:
Intersects with Multi-Stakeholder Alignment and Design Measurement Track. An important component of contract performance is first understanding the value proposition of accountable care, and educating physicians in the tenets of accountable care (e.g., emphasis on team-based care, strong physician/patient relationships, primacy of prevention, focus on outcomes, understanding and addressing social determinants of health).
Measurement Track: Payment Reform
![]()
![]()
![]()
![]()
Capability: Develop provider dashboards and portals
Definition:
Reporting tools displaying defined provider specific metrics and key performance indicators often accessed through a secure website.
Measurement Track: Payment Reform
![]()
![]()
![]()
![]()
Capability: Provide administrative and financial support
Definition:
Support resources available to capture and track alternative payment methodologies across commercial and governmental businesses.
Measurement Track: Payment Reform
![]()
![]()
Capability: Use/application of risk adjustment
Definition:
Adjusts payment incentives and quality performance through risk methodologies. Incorporates social and clinical risk inclusive of goal measurement while monitoring for adverse outcomes.
Resources:
Measurement Track: Payment Reform
![]()
![]()
![]()
![]()
Capability: Management of population-based payment models
Definition:
All or much of a person’s overall care or care for related conditions is encompassed within a single payment. Encourages providers to deliver well-coordinated, high-quality, person-centered care within either a defined scope of practice, a comprehensive collection of care, or a highly integrated finance and delivery system.
Resources:
Measurement Track: Payment Reform
![]()
![]()
Capability: Management of performance risk sharing
Definition:
Share bonuses or upside/downside payments across a group of providers, health systems and/or care delivery services.
Resources:
Measurement Track: Payment Reform
![]()
![]()
Capability: Create risk adjustment methodologies (risk methodology, benchmarking, etc.)
Definition:
Incorporate social and clinical risk adjustment, including risk methodologies and benchmarking, with clear goals and ability to track desired outcomes.
Resources:
Measurement Track: Payment Reform
![]()
![]()
![]()
![]()
Capability: Enhance product and price transparency (episode-level pricing)
Definition:
Share pricing for episode level products and services per governmental standards and in a manner that enables informed decision-making between patient and provider.
Measurement Track: Payment Reform
![]()
![]()
![]()
![]()
Capability: Develop shared savings/losses payment model
Definition:
Participate in alternative payment models which set a benchmark target for cost within a defined population, and provide shared savings or losses based on whether the provider achieves the benchmark (subject to quality, minimum savings/losses rates, or other factors).
Measurement Track: Payment Reform
![]()
![]()
![]()
![]()
Capability: Implement bundled payments
Definition:
Begin participation in episodic payment arrangements that set payment for managing the care for a defined diagnosis or procedure across a preset time period. Develop processes to analyze claims data to evaluate opportunities to reduce clinical variation within episodes. Develop clinical programs that are aligned to alternative payment models.
Resources:
Measurement Track: Payment Reform
![]()
![]()
![]()
![]()
Capability: Enhance provider contracting (generating transparent model, payment model design)
Definition:
Enable data sharing between payers and providers. May include one-time infrastructure payments for care delivery transformation.
Resources:
Measurement Track: Payment Reform
![]()
![]()
![]()
![]()
Capability: Implement shared savings payment model
Definition:
Participate in payment models which set a benchmark target for cost within a defined population, and evaluate performance based on whether the provider achieves the benchmark (subject to quality, minimum savings rates, or other factors). In this model, providers are not subject to any losses for failing to achieve the target, which allows for a lower-financial risk environment to gain experience in these types of arrangements.
Resources:
Measurement Track: Payment Reform
![]()
![]()
![]()
![]()
Capability: Implement pay-for-reporting
Definition: Gaining experience in alternative payment models through payments for reporting data or penalties for not reporting data.
Resources:
Measurement Track: Payment Reform
![]()
![]()
![]()
![]()
Capability: Implement pay-for-performance payment model
Definition:
Participate in alternative payment models that provide incentives based on performance in quality, cost, access and other measures. To the extent possible, work across health plans to standardize the measures used in these alternative payment models, and work with operational stakeholders to establish processes for tracking and monitoring performance on these measures. Include these measures in administrator and clinician goals.
Resources:
Measurement Track: Payment Reform
![]()
Transforming stage supports understanding of the impact population-based payment methodologies have on organizational financial performance and health.
Measurement Track: Payment Reform
![]()
Aligning stage supports increasingly advanced payment models which better align incentives of providers to address cost and quality outcomes to improve affordability.
Measurement Track: Payment Reform
![]()
Investing stage supports alternative payment model framework for outcome reimbursement.
Measurement Track: Payment Reform
![]()
Learning stage supports baseline performance and commitment to develop an understanding of alternative payment models and movement toward accountable care.
Measurement Track: Payment Reform
![]()
![]()
![]()
![]()
Capability: Analysis to identify alternative payment model opportunities
Definition:
Establish process to evaluate readiness to enter into alternative payment models. This process should include a financial analysis and business readiness assessment to evaluate likelihood of success and identify gaps for remediation. Identify the stakeholders across the organization who will need to be engaged in this process, such as payer contracting, clinical operations, care management and information technology.
Resources:
 Emily DuHamel Brower, M.B.A., is senior vice president of clinical integration and physician services for Trinity Health. Emphasizing clinical integration and payment model transformation, Ms. Brower provides strategic direction related to the evolving accountable healthcare environment with strong results. Her team is currently accountable for $10.4B of medical expense for 1.6M lives in Medicare Accountable Care Organizations (ACOs), Medicare Advantage, and Medicaid and Commercial Alternative Payment Models.
Ms. Brower joined Trinity Health from Atrius Health in Massachusetts, where she last served as vice president of Population Health. There, she built and executed the essential capabilities required to achieve strong financial and clinical outcomes within integrated care models under value-based reimbursement, particularly for publicly insured populations.
Prior to her career at Atrius Health, Ms. Brower spent 15 years in leadership roles at Urban Medical Group, a Massachusetts nonprofit healthcare organization specializing in the care of medically complex, chronically ill populations across a community-based, long-term care continuum. During that time, Ms. Brower launched a Program of All-inclusive Care for the Elderly (PACE) program and other innovative, capitated contracts for medically complex populations and served as Principal Investigator for a multi-year research project analyzing cost and quality outcomes to support payment reform.
Ms. Brower received her B.A. from Smith College and her M.B.A. from the New York University Stern School of Business.
 Victor is the Chief Medical Officer for TennCare, Tennessee’s Medicaid Agency. At TennCare, Victor leads the medical office to ensure quality and effective delivery of medical, pharmacy, and dental services to its members. He also leads TennCare’s opioid epidemic strategy, social determinants of health, and practice transformation initiatives across the agency. Prior to joining TennCare, Victor worked at Evolent Health supporting value-based population health care delivery. In 2013, Victor served as a White House Fellow to the Secretary of Health and Human Services. Victor completed his Internal Medicine Residency at Emory University still practices clinically as an internist in the Veteran’s Affairs Health System.
 Tamara Ward is the SVP of Insurance Business Operations at Oscar Health, where she leads the National Network Contracting Strategy and Market Expansion & Readiness. Prior to Oscar she served as VP of Managed Care & Network Operations at TriHealth in Southwest Ohio. With over 15 years of progressive health care experience, she has been instrumental driving collaborative payer provider strategies, improving insurance operations, and building high value networks through her various roles with UHC and other large provider health systems. Her breadth and depth of experience and interest-based approach has allowed her to have success solving some of the most complex issues our industry faces today. Tam is passionate about driving change for marginalized communities, developing Oscar’s Culturally Competent Care Program- reducing healthcare disparities and improving access for the underserved population. Tamara holds a B.A. from the University of Cincinnati’s and M.B.A from Miami University.
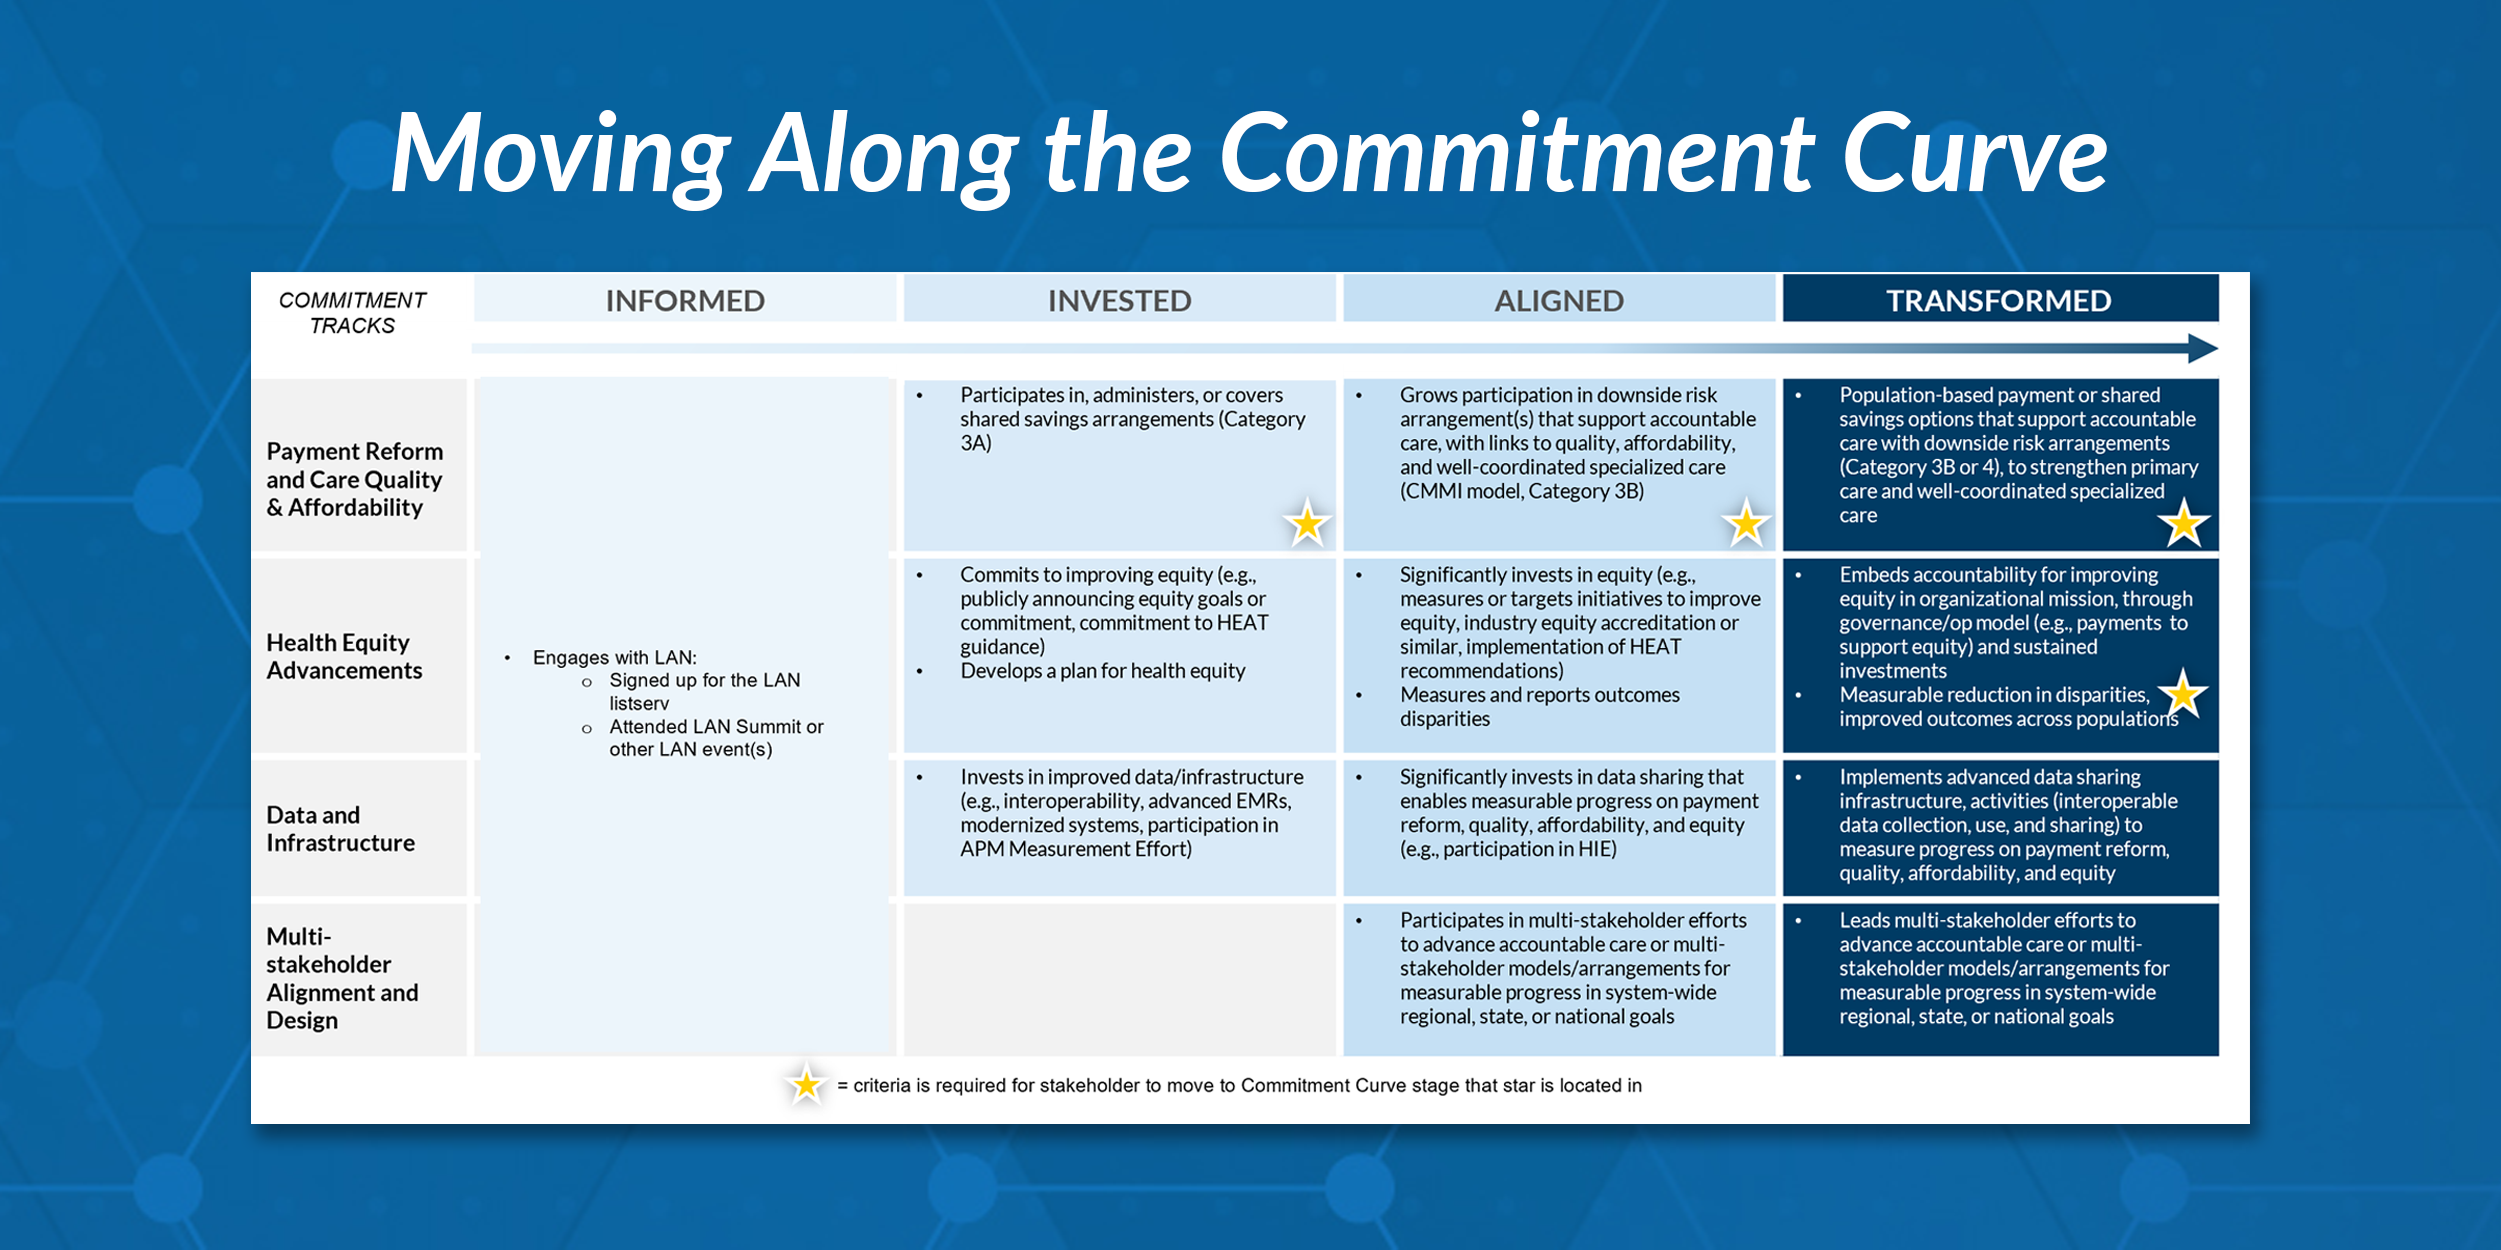
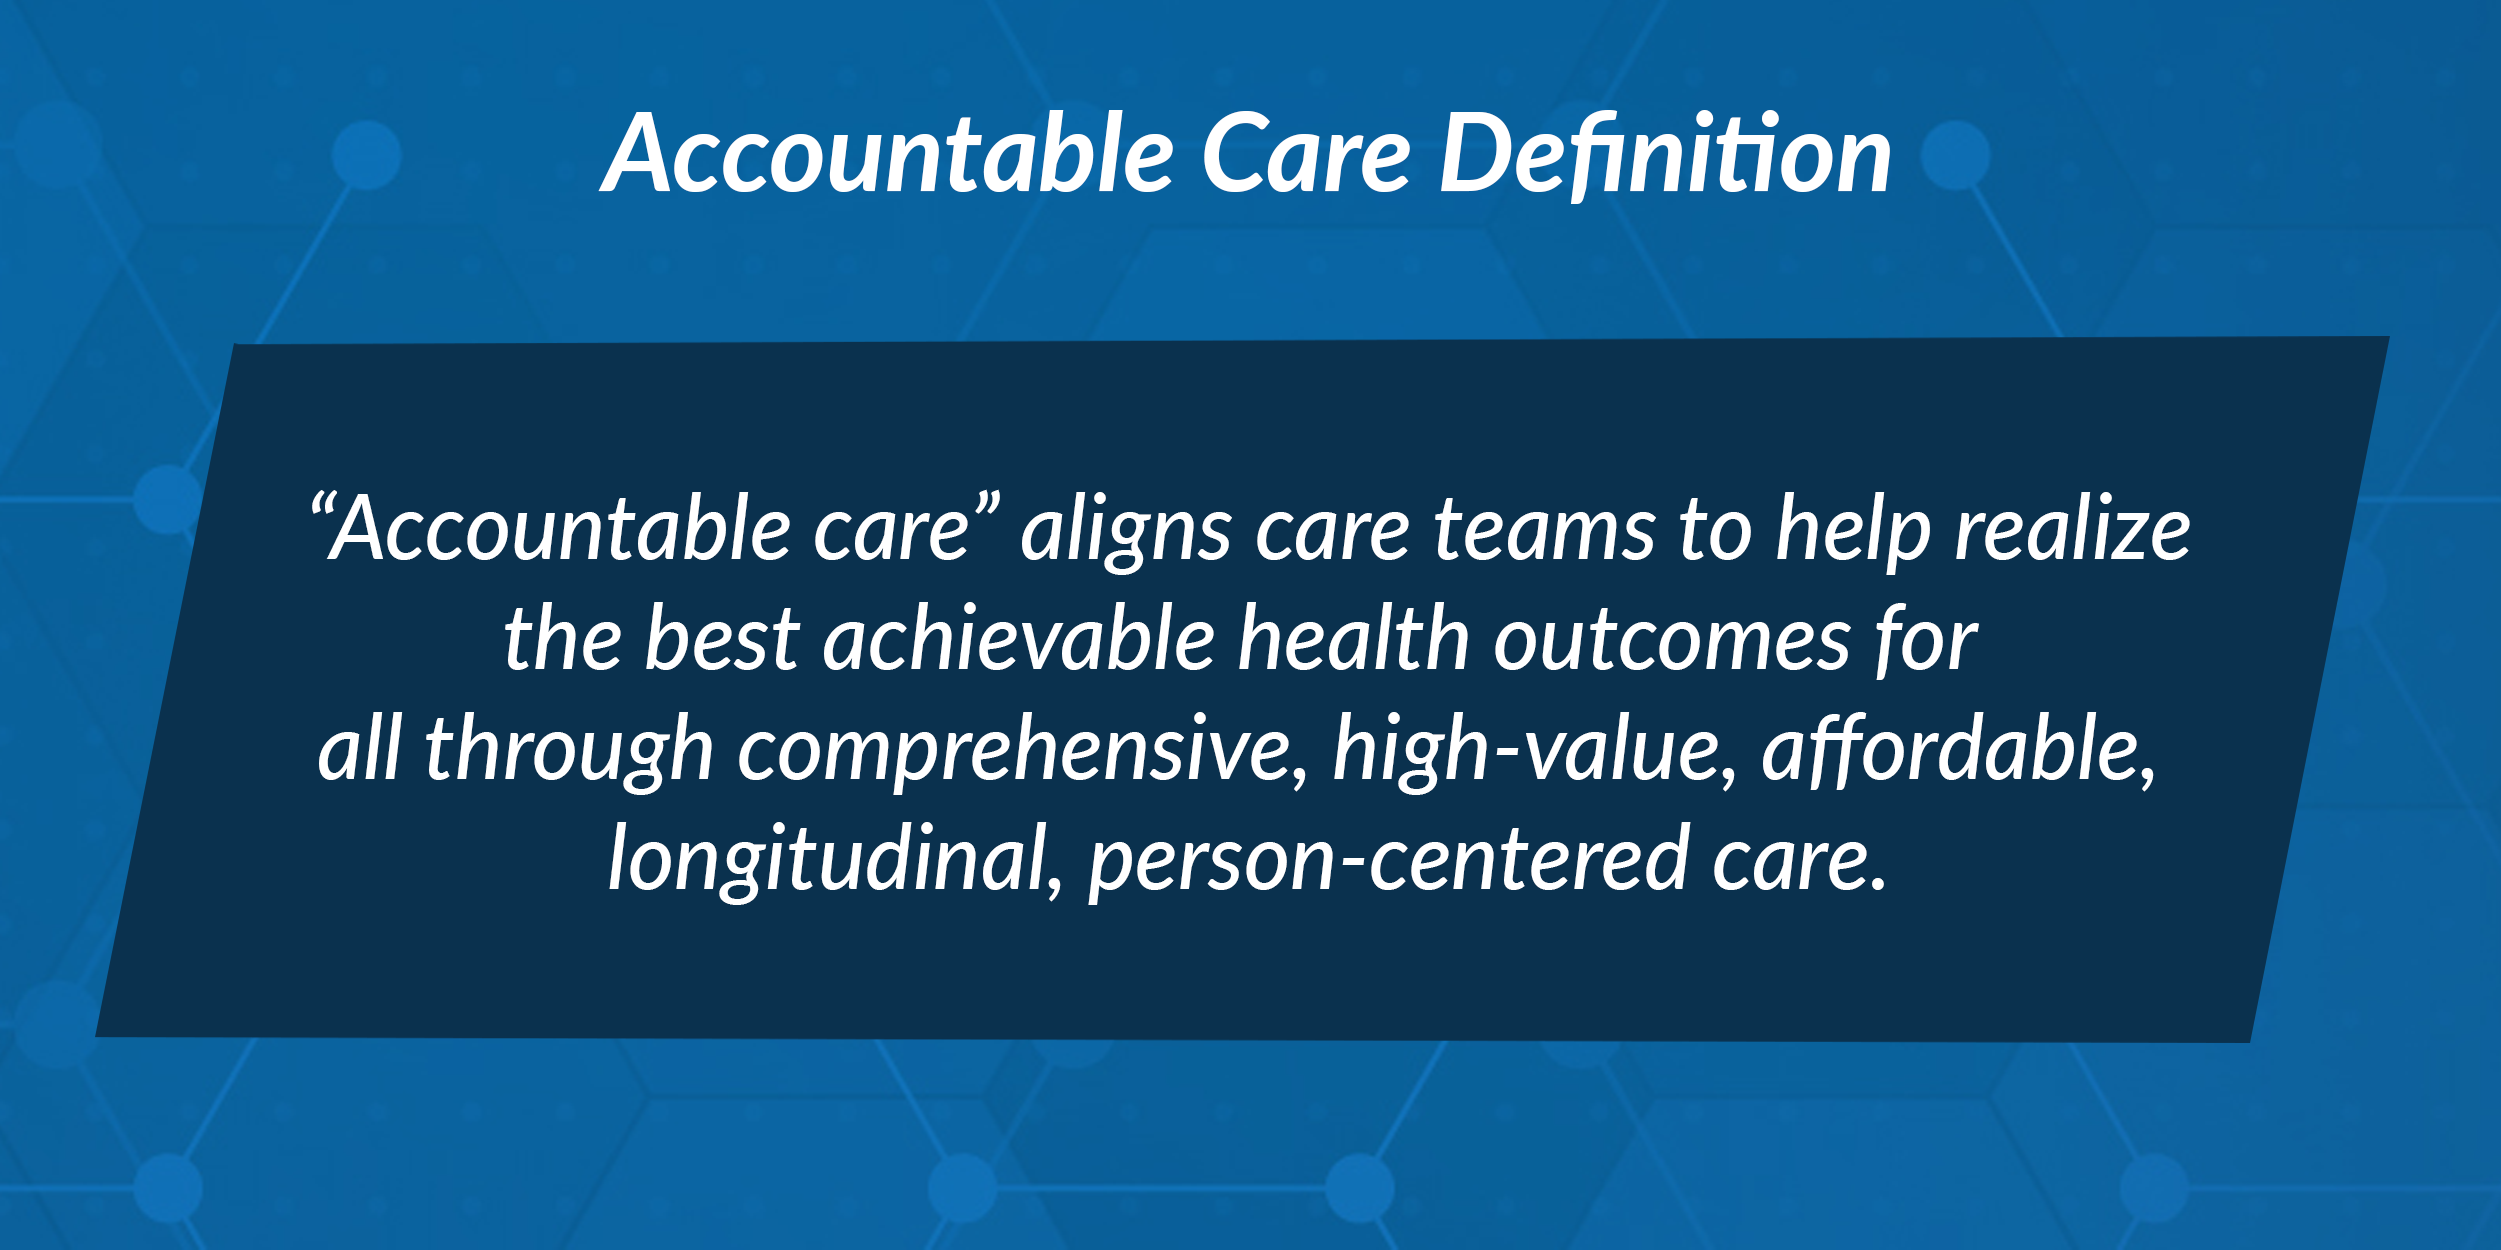
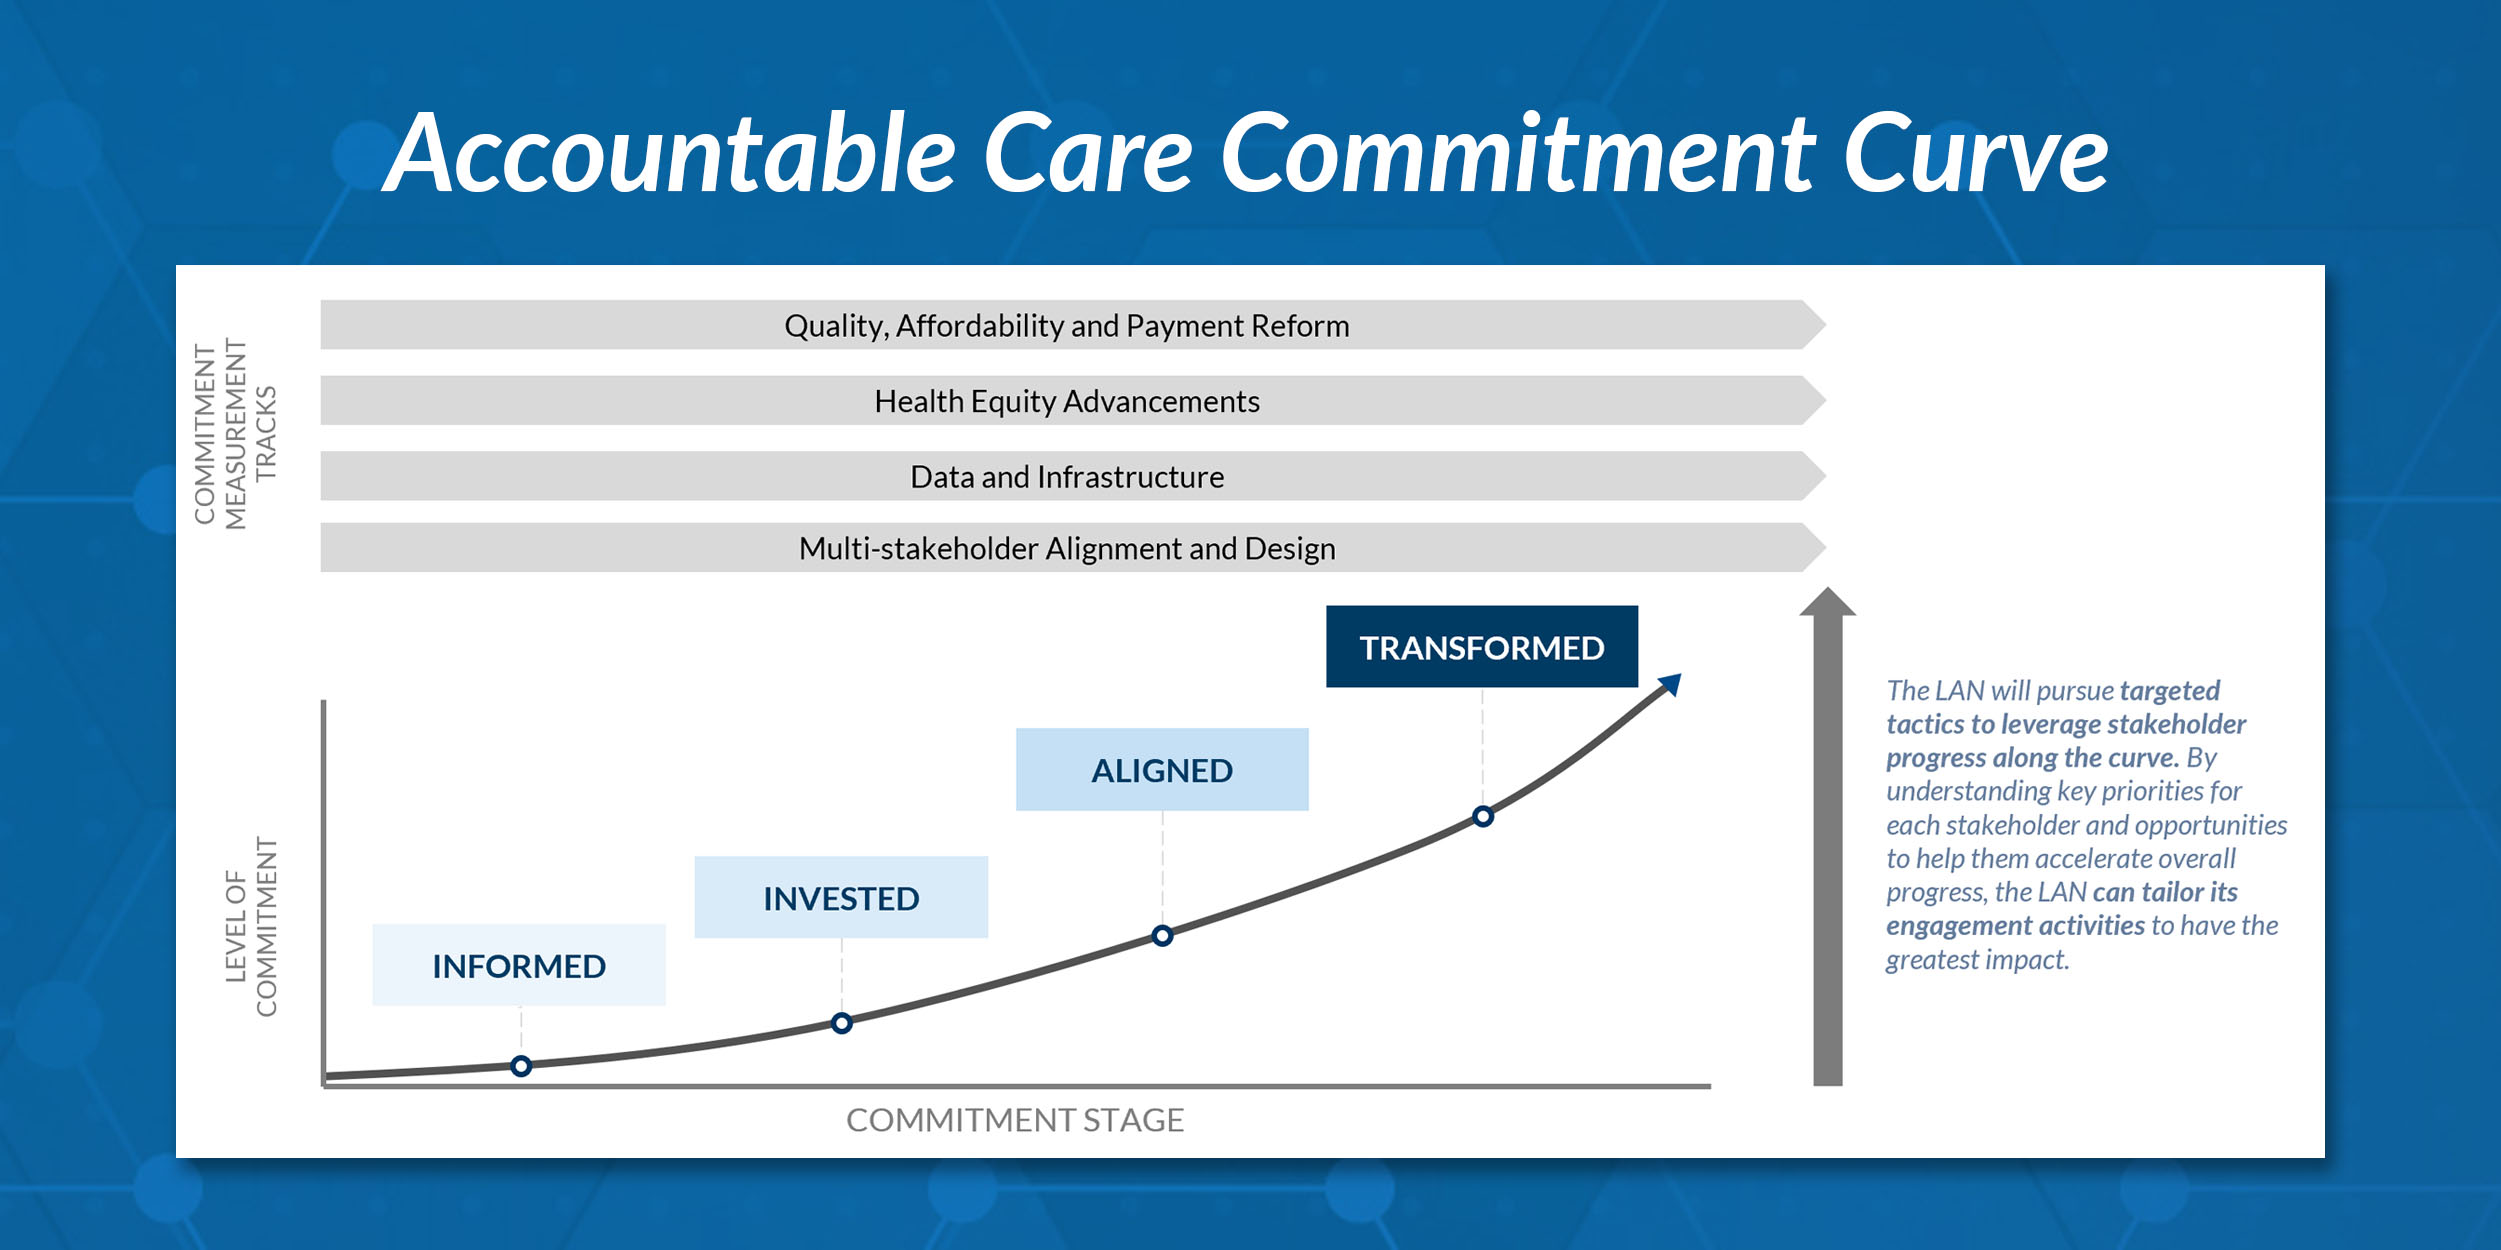
 Dr. Peter Walsh joined the Colorado Department of Health Care Policy and Financing as the Chief Medical Officer on December 1, 2020. Prior to joining HCPF, Dr. Walsh served as a Hospital Field Representative/Surveyor at the Joint Commission, headquartered in Oakbrook Terrace, Illinois.
Dr. Walsh is an Aerospace Medicine Specialist, who provided primary care to aircrew and special operational personnel and their families during much of his 21-year active-duty career in the U.S. Air Force. Upon retirement in 2006 he served as an Urgent Care Physician at the previous Memorial Health System in Colorado Springs between 2006 and 2008 and practiced at the Centura Center for Occupational Medicine in Colorado Springs, CO and Pueblo, CO between 2006 and 2009.
His prior positions include serving as the Chief Medical Officer, South State Operating Group of Centura Health, Corporate Chief Medical Executive for Centura Health in Denver, Colorado, and the VP of Medical Affairs at St. Francis Medical Center in Colorado Springs, Colorado.
Dr. Walsh received his B.A. at the University of Southern California, his M.D. from the Medical College of Ohio in Toledo, Ohio, and a M.P.H. from Harvard School of Public Health. He completed his residency in Aerospace Medicine at the USAF School of Aerospace Medicine at Brooks AFB, Texas.

Brian W. Powers, MD, MBA is Deputy Chief Medical Officer at Humana. In this role, he works across the organization to support rapid learning and evaluation of Humana’s integrated care delivery strategy; to lead research in payment and delivery innovation; and to drive physician engagement, alignment, advocacy, and education across the company. Prior to Humana, he led population health strategy and analytics for CareMore and Aspire Health, both care delivery subsidiaries of Anthem. In prior roles, he was responsible for initiatives to improve health care quality and value at Mass General Brigham, the National Academy of Medicine, and the Massachusetts Health Policy Commission. An accomplished researcher, Dr. Powers is an Assistant Professor of Medicine at the Tufts University School of Medicine, has published peer-reviewed studies in venues such as JAMA, Science, and the New England Journal of Medicine, and serves as Deputy Editor of Healthcare: The Journal of Delivery Science and Innovation. He holds an MD from Harvard Medical School, an MBA from Harvard Business School, and an AB from Bowdoin College. He completed his clinical training in internal medicine and primary care at Brigham and Women’s Hospital and is a practicing internist.

Dr. Palav Babaria was appointed Chief Quality Officer and Deputy Director of Quality and Population Health Management of the California Department of Health Care Services beginning in March 2021. Prior to joining DHCS, she served as Chief Administrative Officer for Ambulatory Services at the Alameda Health System (AHS) where she was responsible for all outpatient clinical operations, quality of care, and strategy for primary care, specialty care, dental services, and integrated and specialty behavioral health, as well as executive sponsor for value-based programs including the Medi-Cal 1115 Waiver. She also previously served as Medical Director of K6 Adult Medicine Clinic, where she managed a large urban hospital-based clinic, overseeing all practitioners, improving quality of care, and patient safety programs. In addition, she served on the Clinical Advisory Committee with the California Association of Public Hospitals/Safety Net Institute. She also has over a decade of global health experience and her work has been published in the New England Journal of Medicine, Academic Medicine, Social Science & Medicine, L.A. Times, and New York Times. Dr. Babaria received her bachelor’s degree from Harvard College, as well as her MD and Master’s in health science from Yale University. She completed her residency training in internal medicine and global health fellowship at the University of California, San Francisco.

Elizabeth Kasper is the Special Policy Advisor for Alternative Payment Models at North Carolina Medicaid. In this role, she works with external and internal stakeholders to support the design and implementation of value-based payment models and policies that advance NC Medicaid’s priorities. Liz’s 20-year career in health policy and health services research has also included work on health quality and public health measures, federally qualified health centers, Medicaid clinical policy, and pharmaceutical regulation and reimbursement. Liz holds a Master of Science in Public Health from the University of North Carolina at Chapel Hill and a BA from Oberlin College.

Mat Spaan, MPA, has worked with the state of Minnesota since 2008 in implementing and developing health policy and payment reform initiatives, with his most recent work managing care delivery and payment activities within the state’s Medicaid program. Since 2013, one of his primary roles is as lead on Minnesota’s Medicaid ACO demonstration, known as the Integrated Health Partnerships (IHP) program, and the development of value-based purchasing in Medicaid.
Mat’s previous state projects have included the development of the state’s All-Payer Claims Database and planning director overseeing the creation of a hospital and physician clinic cost and quality comparison tool. Prior to joining the state, he’s held several interesting positions in the private and nonprofit sectors, including as a manager with a national health advocacy organization, organizer for a neighborhood arts and economic development nonprofit in New Orleans, and as a boat captain on Lake Michigan. Mat earned his Master of Public Administration degree from the University of New Orleans.

Christina Severin is a leading health care executive with more than 20 years of experience and numerous accomplishments in managed care, delivery systems, health insurance, Accountable Care Organizations, quality, public policy, and public health. She has led Community Care Cooperative (C3) since the organization’s launch in 2016, leveraging the proven best practices of ACOs throughout the country, building the organization on the collective strengths of its health centers, and growing the organization to better serve MassHealth members throughout the commonwealth. Christina’s prior leadership experience includes serving as President and Chief Executive Officer of Beth Israel Deaconess Care Organization and as President of Network Health, a nonprofit Massachusetts health plan.

Marc Harrison, M.D., President and CEO of Intermountain Healthcare, is a pediatric critical care physician with a proven track record as a top operation executive on a global scale. He is a national and international thought leader on transformation and innovation—ranking in Fortune’s Top 50 World’s Greatest Leaders in 2019. He also ranked third on Modern Healthcare’s 100 Most Influential People in Healthcare in 2020.
Dr. Harrison is leading Intermountain’s 41,000 employees—who are all called caregivers—to embrace bold new approaches to improve health, re-define value-based care, and serve people in new ways. For example, Intermountain launched Civica Rx, a not-for-profit generic drug manufacturer and distributor, to make generic medications more available and affordable in hospitals across the nation. Intermountain is also a founding member of the Utah Alliance for the Determinants of Health, which is a collaboration of community partners designed to proactively address forces that affect people’s health well before they come to a clinic or a hospital.
Dr. Harrison also served as CEO of Cleveland Clinic Abu Dhabi, Chief of International Business Development at Cleveland Clinic, and Chief Medical Operations Officer at Cleveland Clinic.
He received his undergraduate degree from Haverford College and his medical degree from Dartmouth Medical School, completed a pediatric residency and pediatric care fellowship at Intermountain’s Primary Children’s Hospital, and completed a Master of Medical Management at Carnegie Mellon University.
Dr. Harrison is an all-American triathlete and represented the U.S. at the 2014 World Championships. He is also a two-time cancer survivor with his sights currently on completing an Ironman.