2017 Measurement Effort


The report marks the second year of the LAN APM Measurement Effort, the largest and most comprehensive of its kind at the national level. The findings capture actual 2016 health care spending from four data sources: the LAN, America’s Health Insurance Plans (AHIP), the Blue Cross Blue Shield Association (BCBSA), and the Centers for Medicare and Medicaid Services (CMS) across commercial, Medicaid, Medicare Advantage, and fee-for-service (FFS) Medicare market segments, and categorize them according to the four categories of the original LAN APM Framework.
Conducted from June to August, 2017, the survey collected data from over 80 participants, accounting for nearly 245.4 million Americans, or 84%, of the covered U.S. population. The report shows progress with 29% of total U.S. health care payments tied to alternative payment models (APMs) in 2016 compared to 23% in 2015, a 6 percentage point increase.
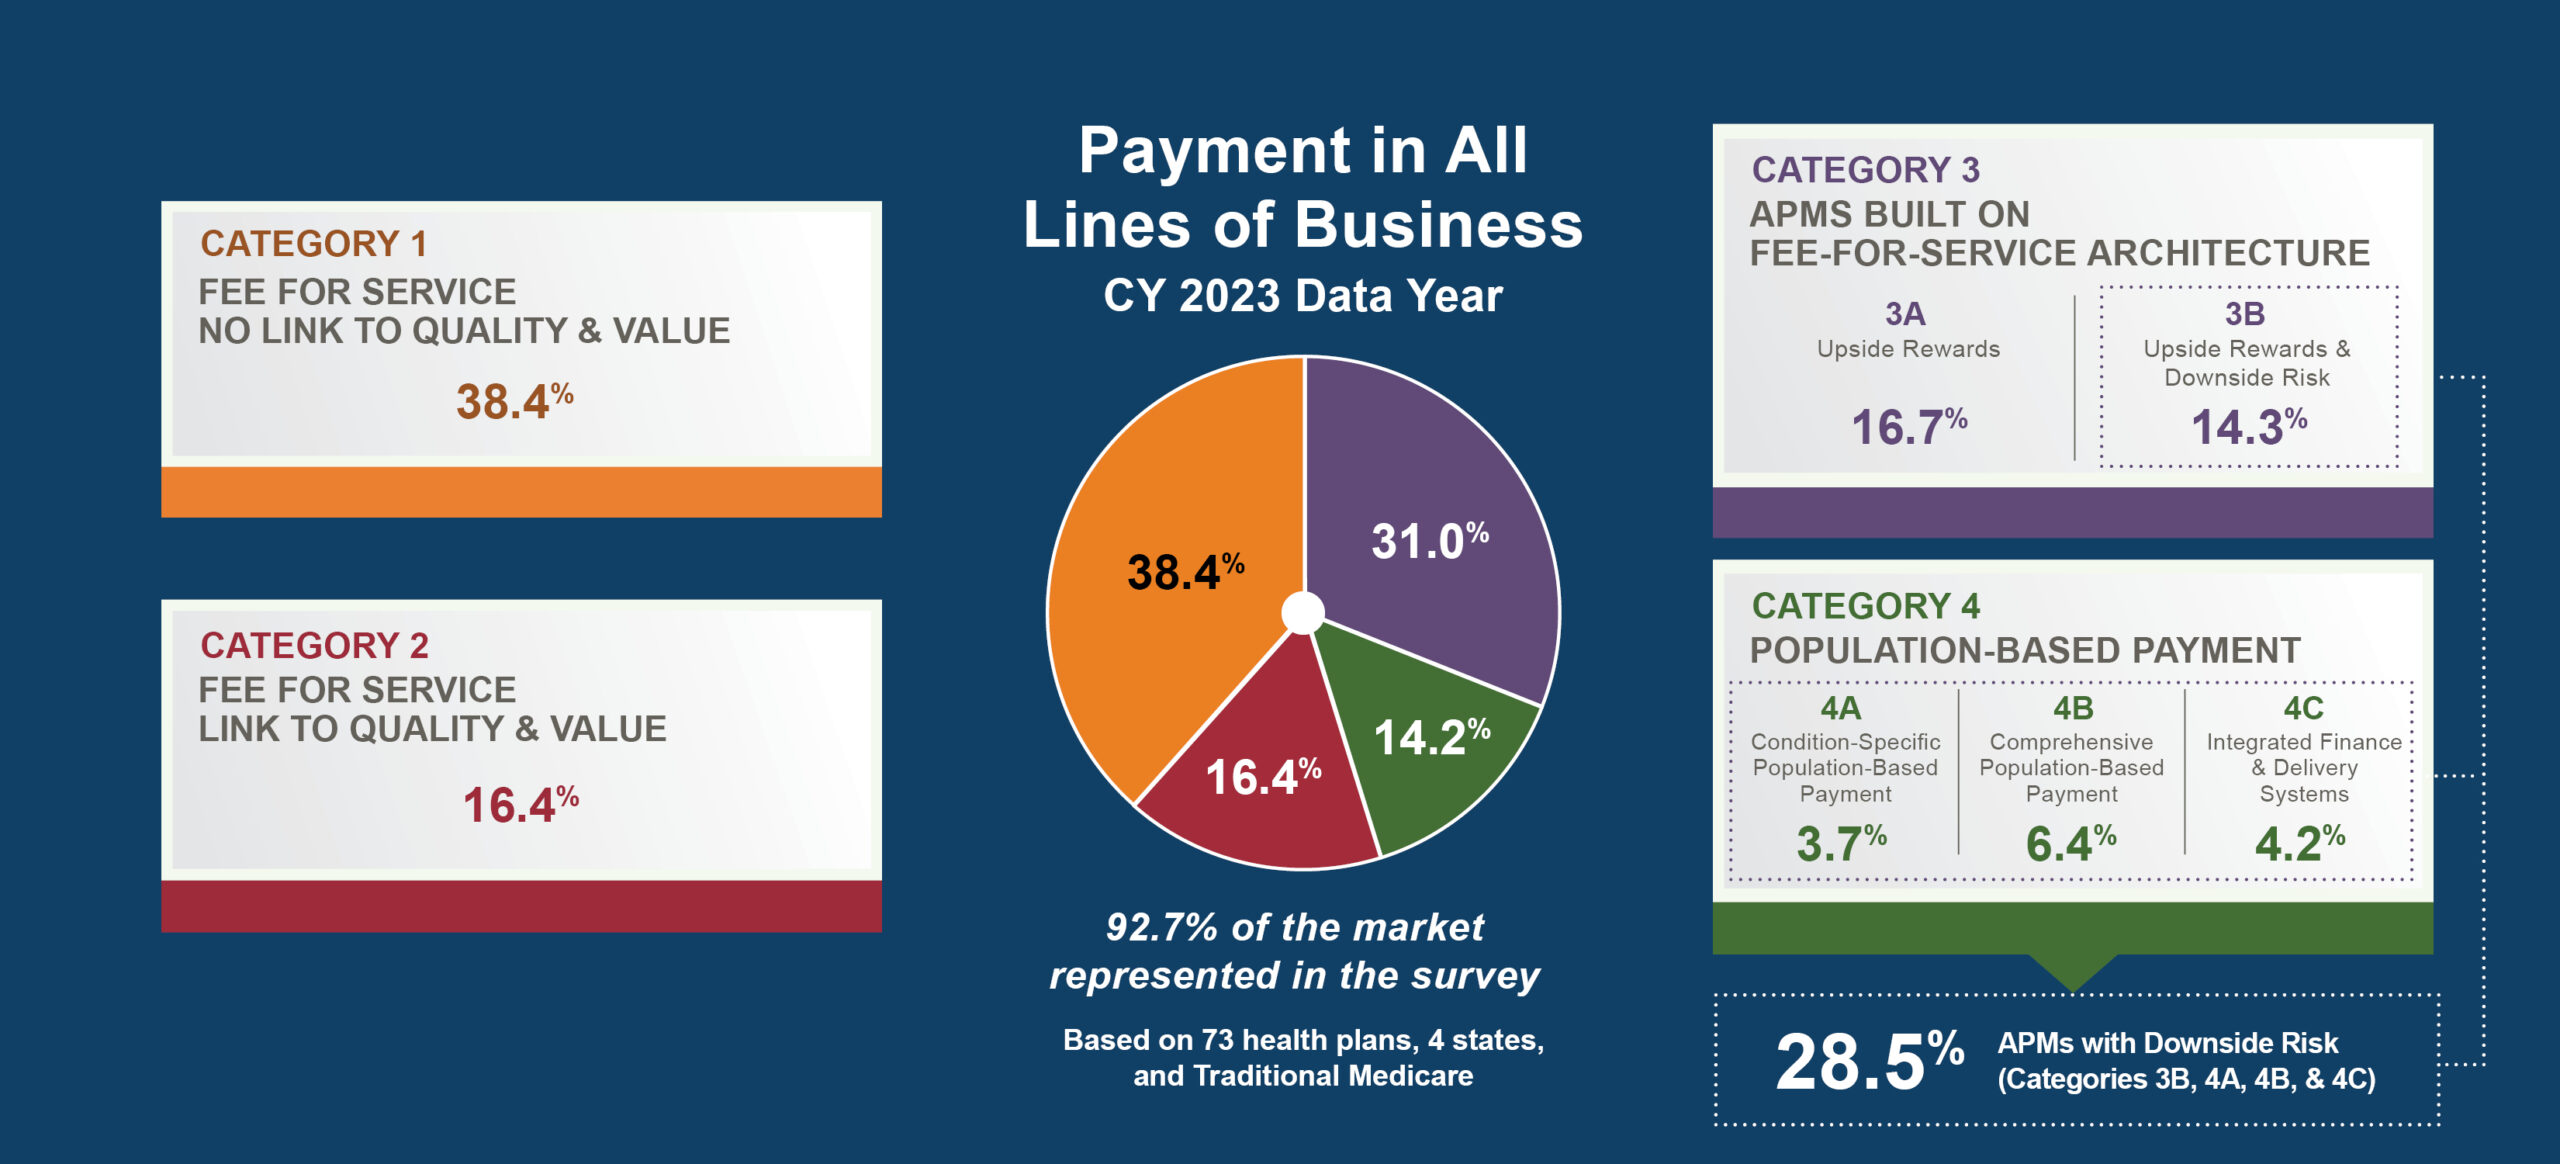
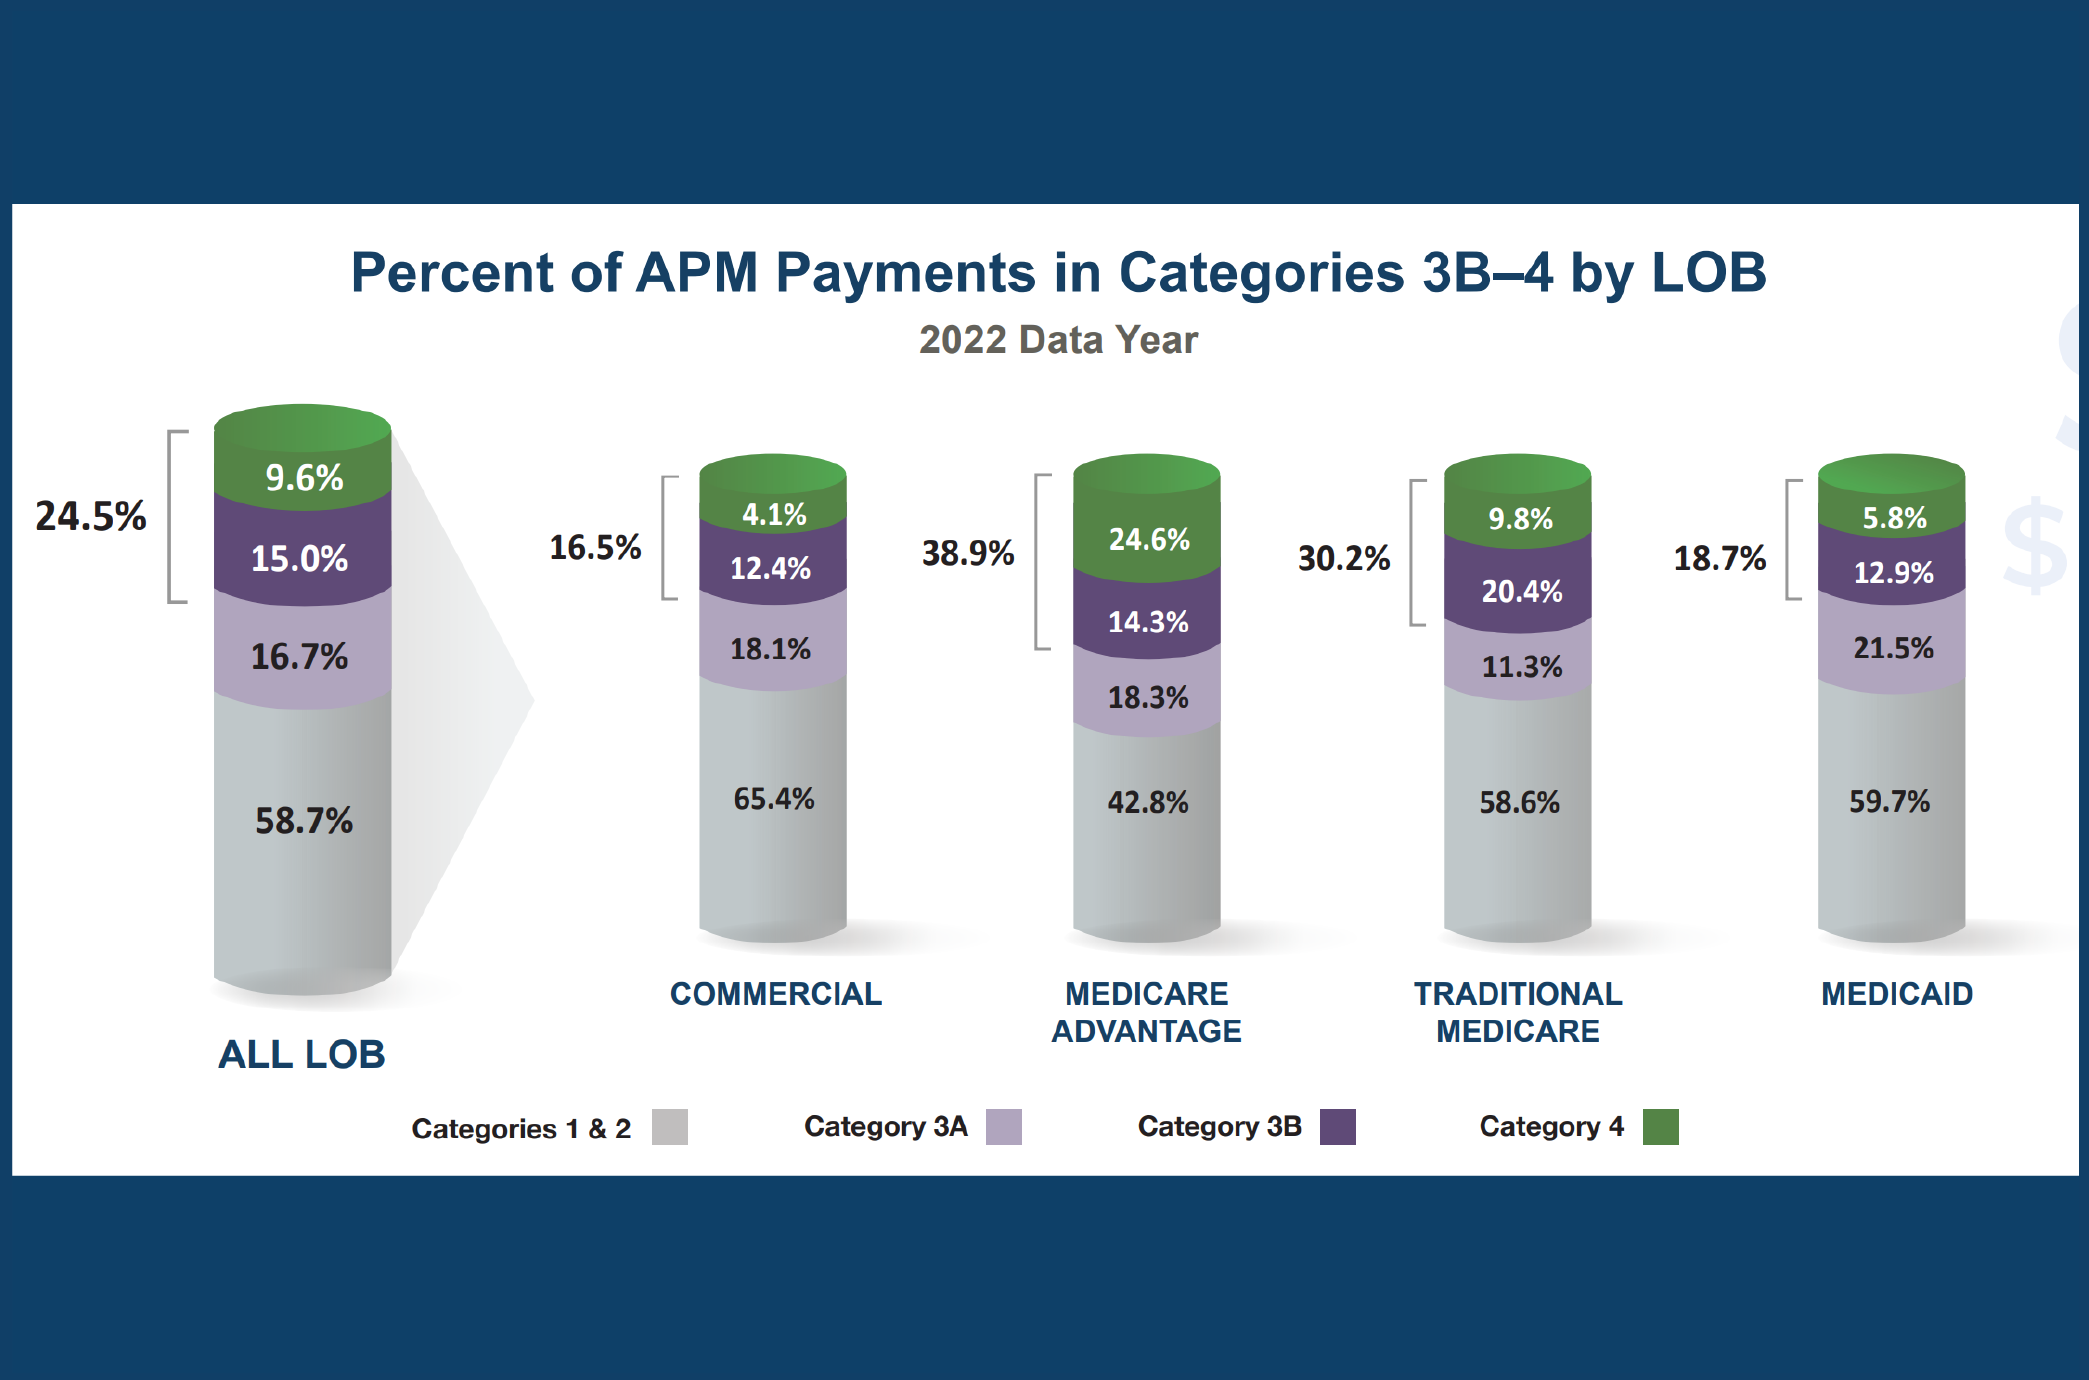
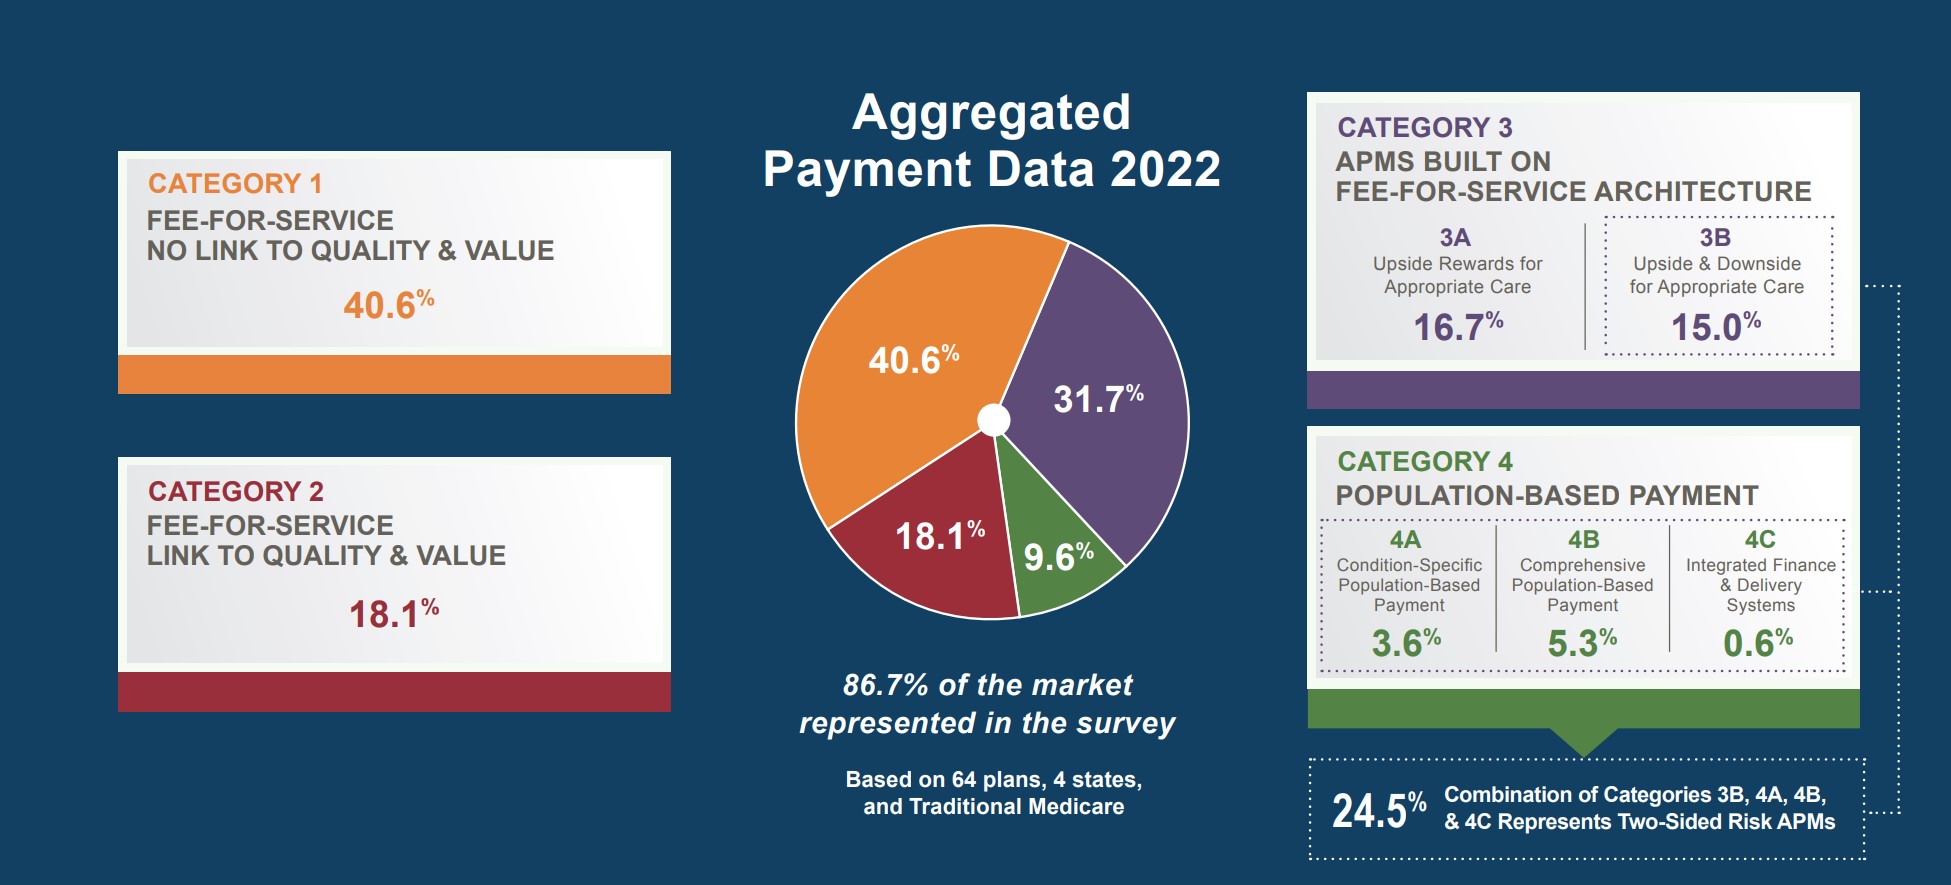
The LAN APM Measurement Effort determined the following results for 2016 payments:
- 43% of health care dollars in Category 1 (e.g., traditional FFS or other legacy payments not linked to quality)
- 28% of health care dollars in Category 2 (e.g., pay-for-performance or care coordination fees)
- 29% of health care dollars in a composite of Categories 3 and 4 (e.g., shared savings, shared risk, bundled payment, or population-based payments)
These results highlight the move away from a fee-for-service system that reimburses only on volume and the move toward more patient-centered APMs. First, there was a shift away from legacy FFS payments and a marked growth in Category 2, where payments are tied to value. Second, there was a 6% increase in alternative payment model payments (Category 3 and 4), bringing total APM spending to approximately $354.5 billion dollars nationally.
Publication Info
Publication date: October 30, 2017
17 pages
Suggested Citation: Health Care Payment Learning & Action Network. Measuring Progress: Adoption of Alternative Payment Models in Commercial, Medicaid, Medicare Advantage, and Fee-for-Service Medicare Programs. October 30, 2017.
The LAN invited health plans across market segments, as well as managed FFS Medicaid states, to quantify the amount of health plan in- and out-of-network spending that flows through APMs – including key areas of available pharmacy and behavioral health spending, if such data were available. Each of the questions in the survey tracked to the categories and subcategories of the original LAN APM Framework, using the LAN survey tool, definitions, and methodology.
In this year’s effort, 78 health plans, three FFS Medicaid states, and FFS Medicare participated, and combines data from the LAN survey, the BCBSA survey, the AHIP survey, and FFS Medicare. Health plans, states, and FFS Medicare reported the total dollars paid to providers according to the original APM Framework through different levels of detail, based on the survey in which they participated. With this data, the LAN calculated aggregate results for Category 1, Category 2, and a composite of Categories 3 and 4, to compare the number to the goals.
For more information on the methodology, please read the Methodology Report above and view the training video below.
The LAN APM Framework establishes standardized definitions and categories of APMs and a methodology for quantifying the adoption of APMs across the public and private sectors. The original LAN APM Framework was developed by the Alternative Payment Models Framework and Progress Tracking (APM FPT) Work Group, which was composed of public and private stakeholders and convened by the LAN Guiding Committee. In mid-2017, a refreshed Framework was released to reflect changes in market dynamics and legislation. For timing and trend reasons, this year’s APM measurement effort used the original Framework.


 Emily DuHamel Brower, M.B.A., is senior vice president of clinical integration and physician services for Trinity Health. Emphasizing clinical integration and payment model transformation, Ms. Brower provides strategic direction related to the evolving accountable healthcare environment with strong results. Her team is currently accountable for $10.4B of medical expense for 1.6M lives in Medicare Accountable Care Organizations (ACOs), Medicare Advantage, and Medicaid and Commercial Alternative Payment Models.
 Mr. James Sinkoff is the Deputy Executive Officer and Chief Financial Officer for Sun River Health (formerly known as Hudson River HealthCare), and the Chief Executive Officer of Solutions 4 Community Health (S4CH); an MSO serving FQHCs and private physician practices.
 Victor is the Chief Medical Officer for TennCare, Tennessee’s Medicaid Agency. At TennCare, Victor leads the medical office to ensure quality and effective delivery of medical, pharmacy, and dental services to its members. He also leads TennCare’s opioid epidemic strategy, social determinants of health, and practice transformation initiatives across the agency. Prior to joining TennCare, Victor worked at Evolent Health supporting value-based population health care delivery. In 2013, Victor served as a White House Fellow to the Secretary of Health and Human Services. Victor completed his Internal Medicine Residency at Emory University still practices clinically as an internist in the Veteran’s Affairs Health System.
 Dr. Brandon G. Wilson, DrPH, MHA (he, him, his) joined Community Catalyst as the Director of the Center for Consumer Engagement in Health Innovation, where he leads the Center in bringing the community’s experience to the forefront of health systems transformation and health reform efforts, in order to deliver better care, better value and better health for every community, particularly vulnerable and historically underserved populations. The Center works directly with community advocates around the country to increase the skills and power they have to establish an effective voice at all levels of the health care system. The Center collaborates with innovative health plans, hospitals and providers to incorporate communities and their lived experience into the design of systems of care. The Center also works with state and federal policymakers to spur change that makes the health system more responsive to communities. And it provides consulting services to health plans, provider groups and other health care organizations to help them create meaningful structures for engagement with their communities.
 Tamara Ward is the SVP of Insurance Business Operations at Oscar Health, where she leads the National Network Contracting Strategy and Market Expansion & Readiness. Prior to Oscar she served as VP of Managed Care & Network Operations at TriHealth in Southwest Ohio. With over 15 years of progressive health care experience, she has been instrumental driving collaborative payer provider strategies, improving insurance operations, and building high value networks through her various roles with UHC and other large provider health systems. Her breadth and depth of experience and interest-based approach has allowed her to have success solving some of the most complex issues our industry faces today. Tam is passionate about driving change for marginalized communities, developing Oscar’s Culturally Competent Care Program- reducing healthcare disparities and improving access for the underserved population. Tamara holds a B.A. from the University of Cincinnati’s and M.B.A from Miami University.
 Dr. Peter Walsh joined the Colorado Department of Health Care Policy and Financing as the Chief Medical Officer on December 1, 2020. Prior to joining HCPF, Dr. Walsh served as a Hospital Field Representative/Surveyor at the Joint Commission, headquartered in Oakbrook Terrace, Illinois.