Frederick Isasi, J.D., M.P.H., is executive director of Families USA (FUSA), one of the nation’s leading nonpartisan, nonprofit health care advocacy organizations established to ensure that all people receive high-quality, affordable, consumer-centered care.
A national thought-leader and subject matter expert on the social issues and solutions related to driving value and equity into health care and providing high-quality coverage, Isasi draws on decades of experience in the health care industry, public policy, and law. In doing so, he advances a pragmatic and intersectional policy agenda for achieving better health at lower costs and reducing systemic inequities in the American health system.
Under Isasi’s leadership, FUSA advocates for issues such as fair drug pricing, racial equity, maternal and child health, and ending surprise medical bills. He also works to strengthen and protect policies such as the Affordable Care Act (ACA), Medicaid, Medicare, the Children’s Health Insurance Program (CHIP), and Oral Health for All.
Isasi founded FUSA’s National Center for Coverage Innovation to help state and federal policymakers and consumer leaders develop and implement pragmatic, nonpartisan approaches to expand and improve health care coverage. He also founded and directs FUSA’s Center on Health Equity Action for System Transformation, the only national entity exclusively dedicated to developing and advancing patient-centered health system transformation policies designed to reduce racial, ethnic, and geographic inequities.
Isasi’s work and experience flow from his life-long commitment to achieving high-quality, affordable health care for all. That passion stems from growing up in North Carolina as the son of Cuban immigrants. He saw first-hand the health care barriers families in poverty, people of color, people with language barriers, and rural communities generally experienced.
Isasi’s passion for change drove his extensive academic accomplishments. He was a Powers-Knapp Scholar at the University of Wisconsin, where he earned a B.S. in Cellular Biology. He earned a Master of Public Health from the University of North Carolina and was inducted into both the Delta Omega and the Frank Porter Graham honor societies. He obtained a J.D. from the Duke University School of Law, where he was a Pamela B. Gann Scholar and a staff editor of the Duke Journal of Gender Law and Policy.
After receiving his Masters in Public Health, Isasi worked as a senior policy advisor at the District of Columbia Primary Care Association, working on issues such as the Master Tobacco Settlements and Medicaid reimbursement. After law school, Frederick joined the international law firm Powell Goldstein (now called Bryan Cave LLP) as a health care attorney with a practice that focused on representing public hospitals and health systems, immigrant health care issues and state Medicaid programs.
Isasi then joined New Mexico Democratic Sen. Jeff Bingaman’s staff, serving as senior legislative counsel for health care to the Senate Finance Committee and the Committee on Health, Education, Labor, and Pensions. Isasi was Senator Binagaman’s principal negotiator throughout closed-door, bipartisan negotiations. He was also the Senator’s advisor and chief negotiator for the CHIP Reauthorization Act of 2009. And he directed Bingaman’s efforts to address Medicare and health care challenges systematically caused by low-income, cultural and racial disparities.
Upon leaving his Senate position, Isasi became vice president for health policy at the Advisory Board Company, a leading international organization that advises 3,100 hospitals, health systems, provider groups, and payers. He founded its health Policy Department. Under Isasi’s leadership, the company leveraged the power of health system data and developed evidence-based policy solutions for modern health care challenges. He also bolstered the company’s work with policymakers in Congress, the Obama Administration, and the states to improve health care transformation efforts across the nation.
After leaving the Advisory Board, Isasi led the health division at the bipartisan National Governors Association’s (NGA) Center for Best Practices. He worked directly with governors of both parties and served as the organization’s national voice on health care delivery and payment reform, improving Medicaid and health exchange planning and oversight. He also directed technical assistance for states as they navigated changes to their health care systems due to national policy shifts.
Isasi frequently testifies on health policy issues in both the Senate and House of Representatives. His public, private, and advocacy work gives Isasi deep expertise in Medicaid, Medicare, private health insurance, health equity, payment, and delivery reform, and the social determinants of health as they intersect with health care quality and payment and equity issues. A skilled communicator able to explain complex issues clearly, he is a sought-after national speaker on health care affordability issues, Medicaid, state health care innovation, health system transformation, and behavioral health.
Isasi has served on a myriad of panels and boards at institutions such as the National Academy of Medicine, the Brookings Institution, the National Committee for Quality Assurance, Duke University’s Margolis Center for Health Policy, Catalyst for Payment Reform, the Health Care Payment Learning & Action Network and Bipartisan Policy Center. He is regularly featured in national outlets, including The New York Times, NBC, Bloomberg, The Wall Street Journal, and The Washington Post.
A Cuban-American, Isasi is a proud member of the LGBTQ+ community and resides in Washington, D.C.















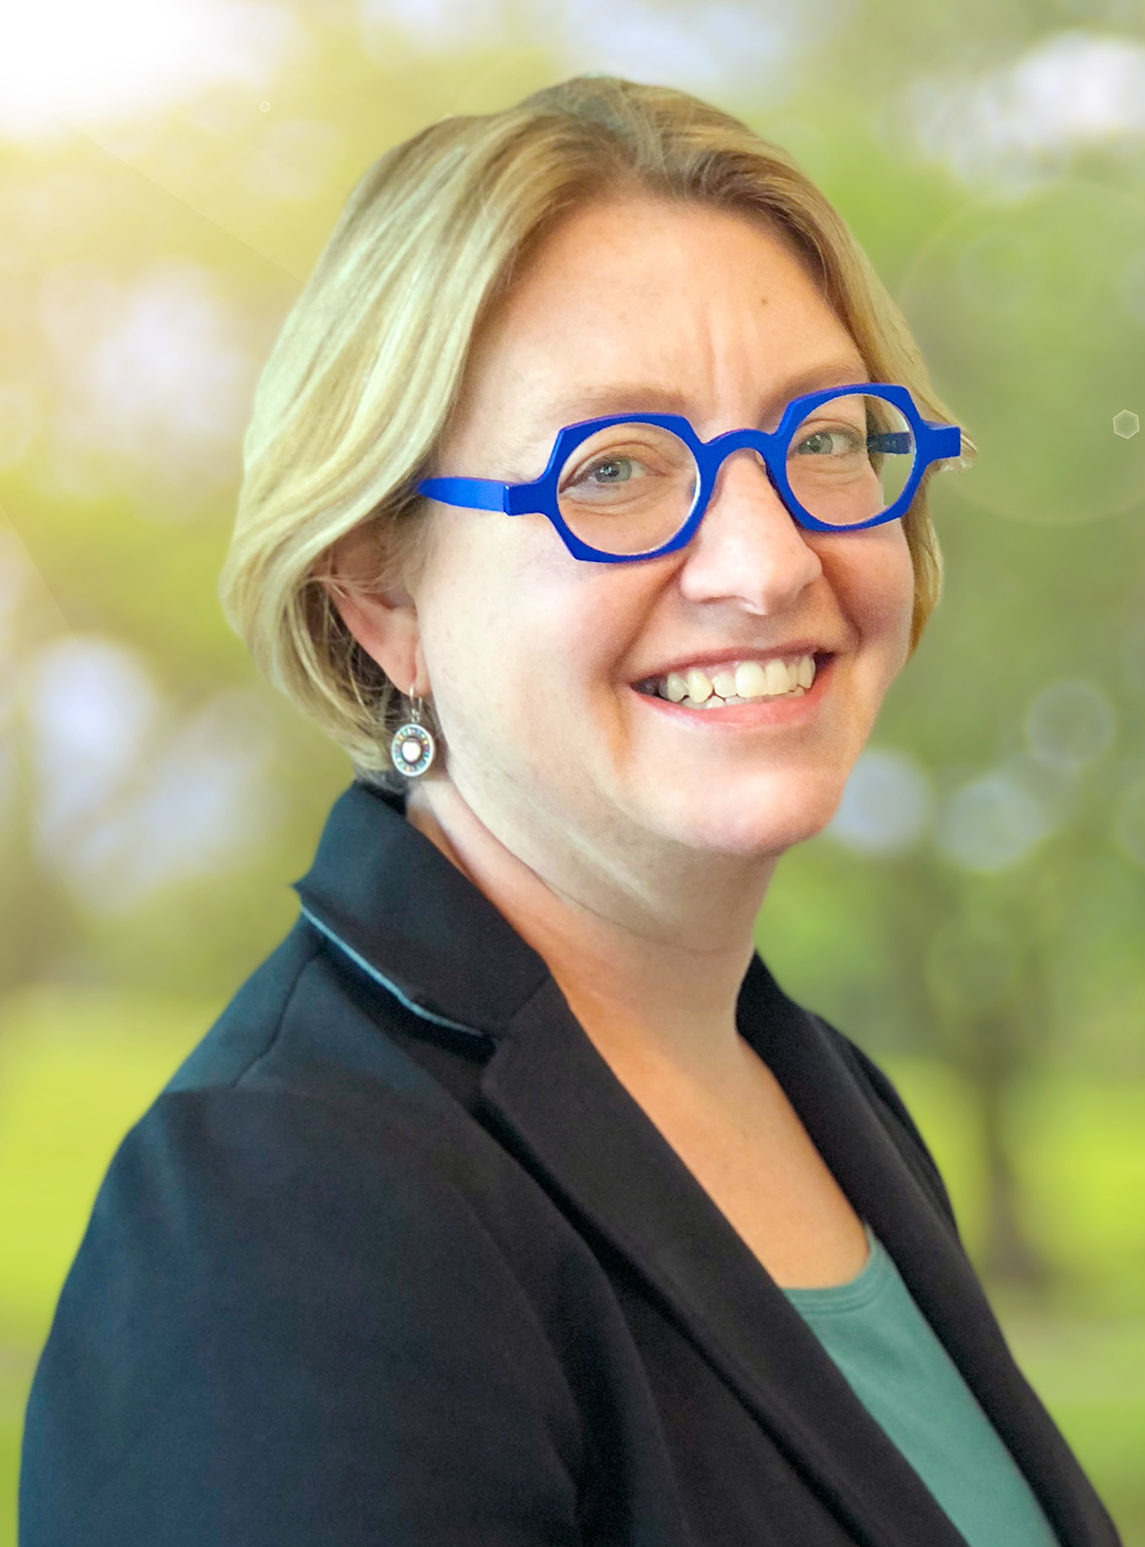
 Emily DuHamel Brower, M.B.A., is senior vice president of clinical integration and physician services for Trinity Health. Emphasizing clinical integration and payment model transformation, Ms. Brower provides strategic direction related to the evolving accountable healthcare environment with strong results. Her team is currently accountable for $10.4B of medical expense for 1.6M lives in Medicare Accountable Care Organizations (ACOs), Medicare Advantage, and Medicaid and Commercial Alternative Payment Models.
 Mr. James Sinkoff is the Deputy Executive Officer and Chief Financial Officer for Sun River Health (formerly known as Hudson River HealthCare), and the Chief Executive Officer of Solutions 4 Community Health (S4CH); an MSO serving FQHCs and private physician practices.
 Victor is the Chief Medical Officer for TennCare, Tennessee’s Medicaid Agency. At TennCare, Victor leads the medical office to ensure quality and effective delivery of medical, pharmacy, and dental services to its members. He also leads TennCare’s opioid epidemic strategy, social determinants of health, and practice transformation initiatives across the agency. Prior to joining TennCare, Victor worked at Evolent Health supporting value-based population health care delivery. In 2013, Victor served as a White House Fellow to the Secretary of Health and Human Services. Victor completed his Internal Medicine Residency at Emory University still practices clinically as an internist in the Veteran’s Affairs Health System.
 Dr. Brandon G. Wilson, DrPH, MHA (he, him, his) joined Community Catalyst as the Director of the Center for Consumer Engagement in Health Innovation, where he leads the Center in bringing the community’s experience to the forefront of health systems transformation and health reform efforts, in order to deliver better care, better value and better health for every community, particularly vulnerable and historically underserved populations. The Center works directly with community advocates around the country to increase the skills and power they have to establish an effective voice at all levels of the health care system. The Center collaborates with innovative health plans, hospitals and providers to incorporate communities and their lived experience into the design of systems of care. The Center also works with state and federal policymakers to spur change that makes the health system more responsive to communities. And it provides consulting services to health plans, provider groups and other health care organizations to help them create meaningful structures for engagement with their communities.
 Tamara Ward is the SVP of Insurance Business Operations at Oscar Health, where she leads the National Network Contracting Strategy and Market Expansion & Readiness. Prior to Oscar she served as VP of Managed Care & Network Operations at TriHealth in Southwest Ohio. With over 15 years of progressive health care experience, she has been instrumental driving collaborative payer provider strategies, improving insurance operations, and building high value networks through her various roles with UHC and other large provider health systems. Her breadth and depth of experience and interest-based approach has allowed her to have success solving some of the most complex issues our industry faces today. Tam is passionate about driving change for marginalized communities, developing Oscar’s Culturally Competent Care Program- reducing healthcare disparities and improving access for the underserved population. Tamara holds a B.A. from the University of Cincinnati’s and M.B.A from Miami University.
 Dr. Peter Walsh joined the Colorado Department of Health Care Policy and Financing as the Chief Medical Officer on December 1, 2020. Prior to joining HCPF, Dr. Walsh served as a Hospital Field Representative/Surveyor at the Joint Commission, headquartered in Oakbrook Terrace, Illinois.


